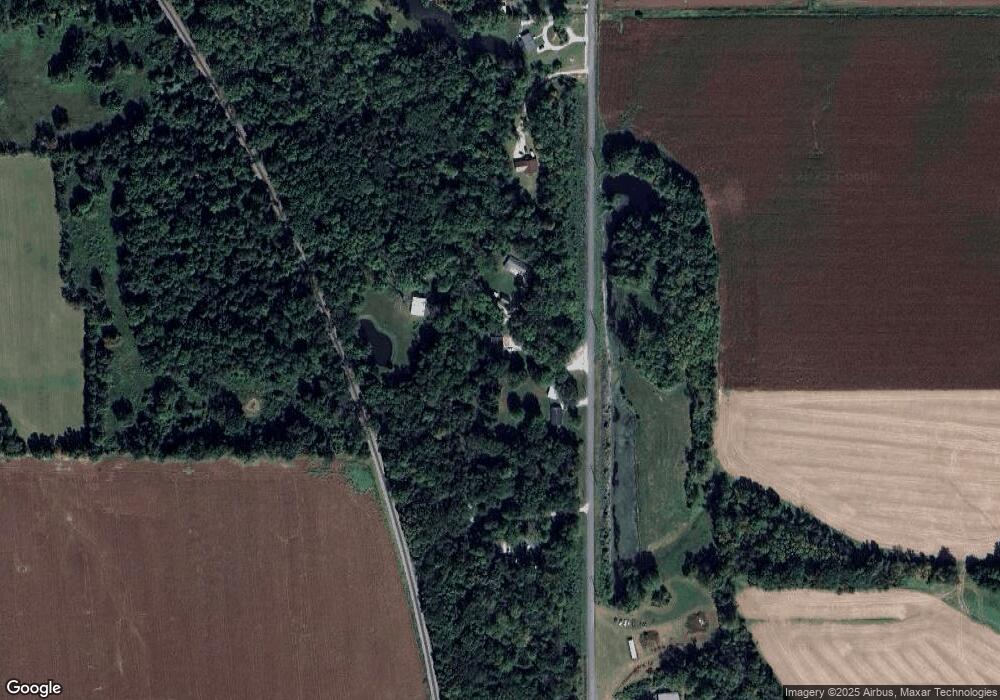
11063 W 50 S Linton, IN 47441
Estimated Value: $135,000 - $154,507
2
Beds
2
Baths
745
Sq Ft
$197/Sq Ft
Est. Value
About This Home
Duplex sits on 2 acres, partially wooded.
Convenient Location, Country Setting!
3 minutes to WalMart & SR 54 or Downtown.
Easy access to SR 59 South of Linton.
South unit (L) available October 1st 2024.
Both bedrooms will fit a queen size bed/nightstand/dresser.
Off street parking for 2 vehicles each unit.
NO pets inside or outside. PLEASE DO NOT DISTURB current tenants.
Ownership History
Date
Name
Owned For
Owner Type
Purchase Details
Closed on
Sep 7, 2018
Sold by
Joan C Bethell
Bought by
Hohmann John and Hohmann Barbara
Current Estimated Value
Home Financials for this Owner
Home Financials are based on the most recent Mortgage that was taken out on this home.
Original Mortgage
$45,000
Outstanding Balance
$39,196
Interest Rate
4.54%
Estimated Equity
$107,306
Create a Home Valuation Report for This Property
The Home Valuation Report is an in-depth analysis detailing your home's value as well as a comparison with similar homes in the area
Home Values in the Area
Average Home Value in this Area
Purchase History
| Date | Buyer | Sale Price | Title Company |
|---|---|---|---|
| Hohmann John | -- | -- |
Source: Public Records
Mortgage History
| Date | Status | Borrower | Loan Amount |
|---|---|---|---|
| Open | Hohmann John | $45,000 | |
| Closed | Hohmann John | -- |
Source: Public Records
Property History
| Date | Event | Price | List to Sale | Price per Sq Ft |
|---|---|---|---|---|
| 10/08/2024 10/08/24 | Off Market | $800 | -- | -- |
| 10/01/2024 10/01/24 | For Rent | $800 | 0.0% | -- |
| 10/01/2024 10/01/24 | Price Changed | $800 | -8.6% | $1 / Sq Ft |
| 08/01/2024 08/01/24 | For Rent | $875 | -- | -- |
Tax History Compared to Growth
Tax History
| Year | Tax Paid | Tax Assessment Tax Assessment Total Assessment is a certain percentage of the fair market value that is determined by local assessors to be the total taxable value of land and additions on the property. | Land | Improvement |
|---|---|---|---|---|
| 2024 | $1,178 | $58,300 | $18,300 | $40,000 |
| 2023 | $1,170 | $57,900 | $18,300 | $39,600 |
| 2022 | $1,213 | $59,200 | $18,300 | $40,900 |
| 2021 | $1,151 | $55,800 | $18,300 | $37,500 |
| 2020 | $1,168 | $56,900 | $18,300 | $38,600 |
| 2019 | $1,126 | $54,500 | $18,300 | $36,200 |
| 2018 | $1,083 | $53,100 | $18,300 | $34,800 |
| 2017 | $1,070 | $52,600 | $18,300 | $34,300 |
| 2016 | $1,065 | $52,600 | $18,300 | $34,300 |
| 2014 | $1,071 | $53,200 | $18,300 | $34,900 |
| 2013 | -- | $53,300 | $18,300 | $35,000 |
Source: Public Records
Map
Nearby Homes
