
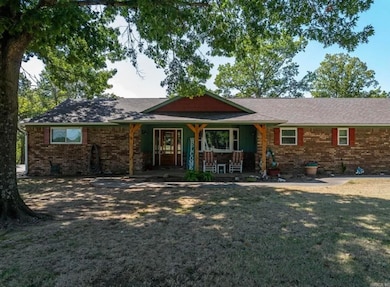
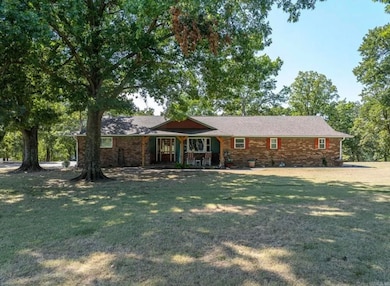
110662 S 4750 Rd Muldrow, OK 74948
Estimated payment $2,168/month
Highlights
- 3.54 Acre Lot
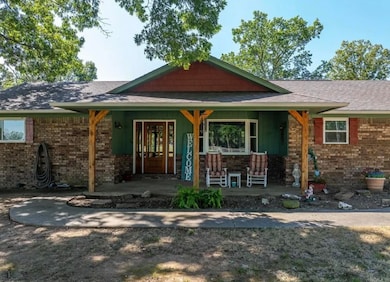
- Ranch Style House
- Formal Dining Room
- Muldrow Elementary School Rated A-
- Workshop
- 1 Car Detached Garage
About This Home
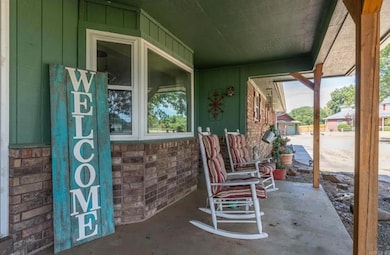
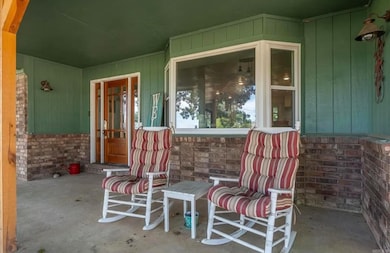
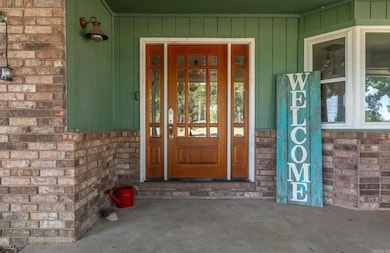
Love Where You Live in Muldrow! Imagine waking up to peaceful views on 3.5± acres, sipping coffee from a rocking chair on the front porch as the sun rises over your private retreat, or ending the day with a glass of sweet tea on the back patio. Step inside to a beautifully remodeled 3 bedroom, 2 bath home where daily life unfolds in an open kitchen, dining, and living space centered around a warm, inviting fireplace. The kitchen features a large, beautiful island with quartz countertops, abundant cabinetry, and a spacious dining room designed to gather family and friends for holidays and celebrations. The spacious primary suite feels like a spa getaway with a custom tiled walk-in shower and a luxurious soaker tub—perfect for relaxing after a long day. Outside, you’ll find room to entertain with backyard cookouts, evenings by the fire, and wide-open space for kids, pets, or simply enjoying the fresh air. A detached shop with one-car garage and electric expands the possibilities, complete with a finished bonus room ideal for hobbies, an office, or retreat, plus a lean-to for your boat, mower, or side-by-side.
Home Details
Home Type
- Single Family
Est. Annual Taxes
- $676
Year Built
- Built in 1983
Lot Details
- 3.54 Acre Lot
- Rural Setting
Home Design
- Ranch Style House
- Brick Exterior Construction
- Slab Foundation
- Architectural Shingle Roof
Interior Spaces
- 2,138 Sq Ft Home
- Wood Burning Fireplace
- Formal Dining Room
- Workshop
- Tile Flooring
Kitchen
- Eat-In Kitchen
- Dishwasher
Bedrooms and Bathrooms
- 3 Bedrooms
- 3 Full Bathrooms
Parking
- 1 Car Detached Garage
- Carport
Utilities
- Central Air
- Septic System
Map
Home Values in the Area
Average Home Value in this Area
Tax History
| Year | Tax Paid | Tax Assessment Tax Assessment Total Assessment is a certain percentage of the fair market value that is determined by local assessors to be the total taxable value of land and additions on the property. | Land | Improvement |
|---|---|---|---|---|
| 2024 | $676 | $10,516 | $1,918 | $8,598 |
| 2023 | $676 | $10,517 | $2,041 | $8,476 |
| 2022 | $676 | $10,517 | $2,122 | $8,395 |
| 2021 | $676 | $10,517 | $2,300 | $8,217 |
| 2020 | $676 | $10,517 | $2,300 | $8,217 |
| 2019 | $676 | $10,516 | $2,046 | $8,470 |
| 2018 | $676 | $10,516 | $2,046 | $8,470 |
| 2017 | $676 | $10,516 | $2,046 | $8,470 |
| 2016 | $676 | $10,516 | $2,046 | $8,470 |
| 2015 | $676 | $10,516 | $2,046 | $8,470 |
| 2014 | $747 | $10,516 | $2,046 | $8,470 |
Property History
| Date | Event | Price | List to Sale | Price per Sq Ft |
|---|---|---|---|---|
| 10/09/2025 10/09/25 | Price Changed | $399,900 | -17.5% | $187 / Sq Ft |
| 09/21/2025 09/21/25 | For Sale | $485,000 | +21.3% | $227 / Sq Ft |
| 09/21/2025 09/21/25 | For Sale | $399,900 | -- | $187 / Sq Ft |
Purchase History
| Date | Type | Sale Price | Title Company |
|---|---|---|---|
| Warranty Deed | -- | None Available | |
| Interfamily Deed Transfer | -- | None Available | |
| Warranty Deed | -- | -- | |
| Warranty Deed | -- | -- |
Mortgage History
| Date | Status | Loan Amount | Loan Type |
|---|---|---|---|
| Open | $117,000 | New Conventional |
Source: Cooperative Arkansas REALTORS® MLS
MLS Number: 25038349
APN: 0000-20-011-026-0-034-00
Disclaimer: Certain information contained herein is derived from information provided by parties other than Homes.com. All information provided is deemed reliable, but is not guaranteed to be accurate and should be independently verified.
![]() IDX information is provided exclusively for personal, non-commercial use, and may not be used for any purpose other than to identify prospective properties consumers may be interested in purchasing.
IDX information is provided exclusively for personal, non-commercial use, and may not be used for any purpose other than to identify prospective properties consumers may be interested in purchasing.
- 304 Oakdale Rd
- 110907 S 4760 Rd
- 505 Juniper Ln
- 0 N Cottonwood Rd
- 2000 N Cottonwood Rd
- 110127 S 4760 Rd
- 111182 S 4760 Rd
- 109365 S 4749 Rd
- 103 NE 1st St
- 0000 Cottonwood Rd
- 473925 E 1117 Rd
- 503 S Dogwood St
- 302 E Shawntel Smith Blvd
- 320 Neal Dr
- 1114 S Dogwood St
- 107 7th St
- 111587 S 4760 Rd
- 101 NE 2nd St
- 103756 Oklahoma 64b
- 103 Drake Dr
