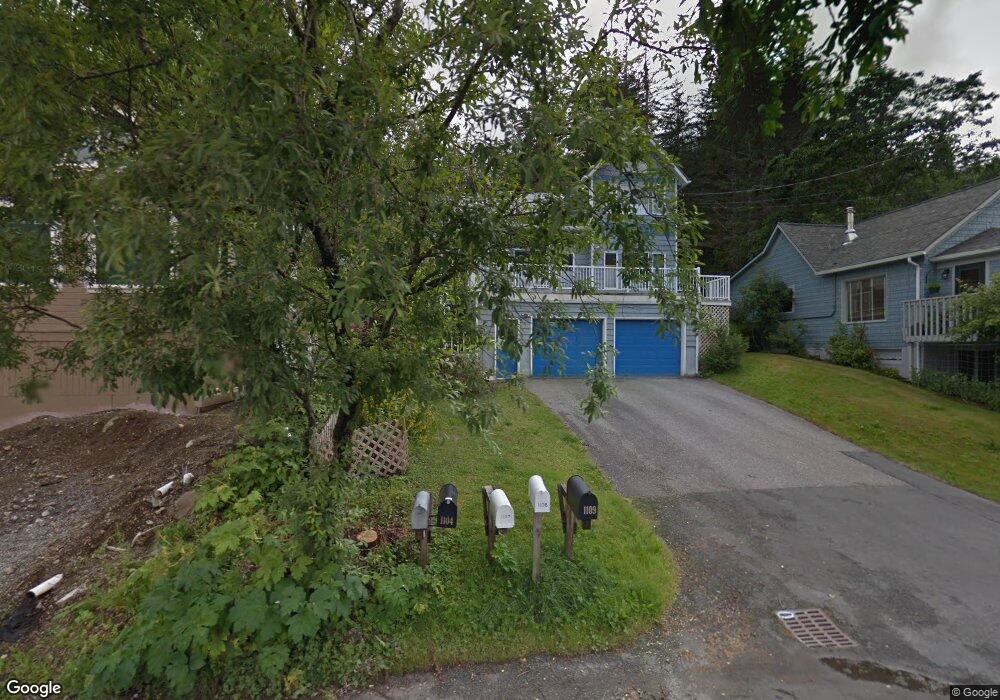
1107 5th St Douglas, AK 99824
Douglas NeighborhoodEstimated Value: $481,000 - $562,877
3
Beds
2
Baths
1,281
Sq Ft
$398/Sq Ft
Est. Value
About This Home
This home is located at 1107 5th St, Douglas, AK 99824 and is currently estimated at $509,219, approximately $397 per square foot. 1107 5th St is a home located in Juneau City and Borough with nearby schools including Saytik: Gastineau Community School and Juneau Montessori School.
Ownership History
Date
Name
Owned For
Owner Type
Purchase Details
Closed on
Jul 22, 2005
Sold by
Hennon Paul E and Hennon Susan L
Bought by
Bryant Mason D
Current Estimated Value
Home Financials for this Owner
Home Financials are based on the most recent Mortgage that was taken out on this home.
Original Mortgage
$240,000
Outstanding Balance
$124,067
Interest Rate
5.51%
Mortgage Type
Purchase Money Mortgage
Estimated Equity
$385,152
Create a Home Valuation Report for This Property
The Home Valuation Report is an in-depth analysis detailing your home's value as well as a comparison with similar homes in the area
Home Values in the Area
Average Home Value in this Area
Purchase History
| Date | Buyer | Sale Price | Title Company |
|---|---|---|---|
| Bryant Mason D | -- | First American Title Ins Co |
Source: Public Records
Mortgage History
| Date | Status | Borrower | Loan Amount |
|---|---|---|---|
| Open | Bryant Mason D | $240,000 |
Source: Public Records
Tax History
| Year | Tax Paid | Tax Assessment Tax Assessment Total Assessment is a certain percentage of the fair market value that is determined by local assessors to be the total taxable value of land and additions on the property. | Land | Improvement |
|---|---|---|---|---|
| 2025 | $3,697 | $511,000 | $131,100 | $379,900 |
| 2024 | $3,624 | $511,000 | $131,100 | $379,900 |
| 2023 | $3,803 | $524,300 | $131,100 | $393,200 |
| 2022 | $3,257 | $458,400 | $125,500 | $332,900 |
| 2021 | $2,810 | $416,100 | $125,500 | $290,600 |
| 2020 | $2,645 | $398,100 | $125,500 | $272,600 |
| 2019 | $2,664 | $399,900 | $125,500 | $274,400 |
Source: Public Records
Map
Nearby Homes
- 1009 2nd St
- 615 5th St
- 2185 Crow Hill Dr
- 2160 Lawson Creek Rd Unit C
- 2160 Lawson Creek Rd Unit D7
- 2196 Lawson Creek Rd Unit D
- 2196 Lawson Creek Rd
- 2213 Raven Rd Unit D
- 2350 Old Lawson Creek Rd
- NHN Vista Dr
- 2718 Roger St
- 2751 David St
- 2753 John St
- 2909 Simpson Ave
- 2950 Simpson Ave
- 356 S Franklin St
- 0 Merritt Rd
- 0 Pioneer Ave
- 3030 Foster Ave
- 3185 Pioneer Ave