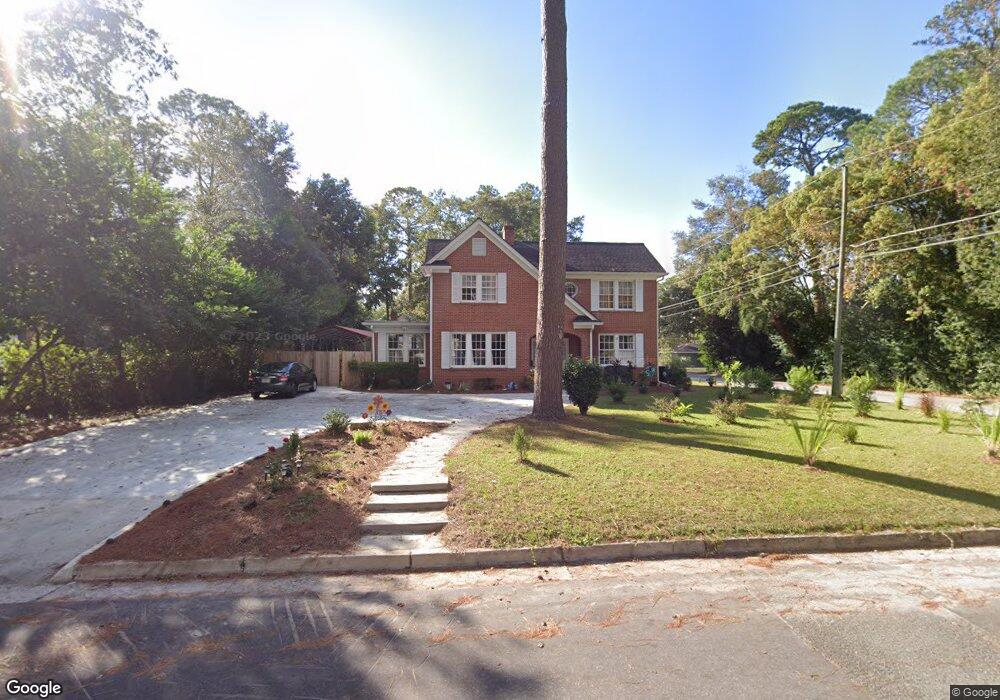
1107 Cherokee Dr Waycross, GA 31501
Estimated Value: $255,000 - $273,000
4
Beds
3
Baths
3,412
Sq Ft
$77/Sq Ft
Est. Value
About This Home
This home is located at 1107 Cherokee Dr, Waycross, GA 31501 and is currently estimated at $263,734, approximately $77 per square foot. 1107 Cherokee Dr is a home located in Ware County with nearby schools including Williams Heights Elementary School, Waycross Middle School, and Ware County High School.
Ownership History
Date
Name
Owned For
Owner Type
Purchase Details
Closed on
Sep 25, 2020
Sold by
Adams Margaret E
Bought by
Adams Raymond E
Current Estimated Value
Purchase Details
Closed on
Sep 8, 2020
Sold by
Adams Raymond E
Bought by
Adams Margaret
Purchase Details
Closed on
Jun 19, 2018
Sold by
Harris Echols John T
Bought by
Adams Margaret E and Adams Raymond E
Home Financials for this Owner
Home Financials are based on the most recent Mortgage that was taken out on this home.
Original Mortgage
$119,700
Interest Rate
4.6%
Mortgage Type
New Conventional
Purchase Details
Closed on
Aug 27, 1998
Sold by
Hopkins Stephen P
Bought by
Echols John and Echols Tricia
Purchase Details
Closed on
Jan 28, 1993
Bought by
Hopkins Stephen P
Purchase Details
Closed on
Dec 30, 1991
Bought by
Hopkins Stephen P
Purchase Details
Closed on
Aug 3, 1987
Create a Home Valuation Report for This Property
The Home Valuation Report is an in-depth analysis detailing your home's value as well as a comparison with similar homes in the area
Home Values in the Area
Average Home Value in this Area
Purchase History
| Date | Buyer | Sale Price | Title Company |
|---|---|---|---|
| Adams Raymond E | $120,000 | -- | |
| Adams Margaret | -- | -- | |
| Adams Margaret E | $126,000 | -- | |
| Echols John | $137,900 | -- | |
| Hopkins Stephen P | -- | -- | |
| Hopkins Stephen P | $102,000 | -- | |
| -- | $98,000 | -- |
Source: Public Records
Mortgage History
| Date | Status | Borrower | Loan Amount |
|---|---|---|---|
| Previous Owner | Adams Margaret E | $119,700 |
Source: Public Records
Tax History Compared to Growth
Tax History
| Year | Tax Paid | Tax Assessment Tax Assessment Total Assessment is a certain percentage of the fair market value that is determined by local assessors to be the total taxable value of land and additions on the property. | Land | Improvement |
|---|---|---|---|---|
| 2024 | $3,188 | $95,860 | $7,840 | $88,020 |
| 2023 | $3,306 | $96,415 | $5,216 | $91,199 |
| 2022 | $3,842 | $96,415 | $5,216 | $91,199 |
| 2021 | $2,076 | $81,030 | $5,216 | $75,814 |
| 2020 | $3,051 | $70,003 | $5,216 | $64,787 |
| 2019 | $2,228 | $67,705 | $5,216 | $62,489 |
| 2018 | $2,919 | $65,408 | $5,216 | $60,192 |
| 2017 | $2,852 | $65,408 | $5,216 | $60,192 |
| 2016 | $2,852 | $65,408 | $5,216 | $60,192 |
| 2015 | $2,872 | $65,407 | $5,216 | $60,192 |
| 2014 | $2,869 | $65,408 | $5,216 | $60,192 |
| 2013 | -- | $65,311 | $5,215 | $60,096 |
Source: Public Records
Map
Nearby Homes
- 1101 Cherokee Dr
- 511 Richmond Ave
- 506 Magnolia Dr
- 707 Euclid Ave
- 807 College St
- 808 Satilla Blvd
- 0 Saint Marys Dr Unit (TRACT 2 0.25 ACRES)
- 713 Magnolia Dr
- 1500 Saint Marys Dr
- 903 Atlantic Ave
- 1701 Satilla Blvd
- 706 Cherokee Cir
- 907 Euclid Ave
- 1001 Coral Rd
- 1009 Euclid Ave
- 1205 Dean Dr
- 415 Dewey St
- 1100 Atlantic Ave
- 1100 Euclid Ave
- 502 Dewey St
- 1105 Cherokee Dr
- 502 Baltimore Ave
- 1215 Cherokee Dr
- 501 Baltimore Ave
- 1112 Hill St
- 1104 Cherokee Dr
- 1112 Cherokee Dr
- 0000 Hill St Tract 3
- 502 Pennsylvania Ave
- 1200 Cherokee Dr
- 1015 Cherokee Dr
- 503 Richmond Ave
- 1014 Cherokee Dr
- 510 Richmond Ave
- 1107 Hill St
- 1301 Cherokee Dr
- 1001 Cherokee Dr
- 1109 Satilla Blvd
- 1205 Satilla Blvd Unit B
- 1205 Satilla Blvd