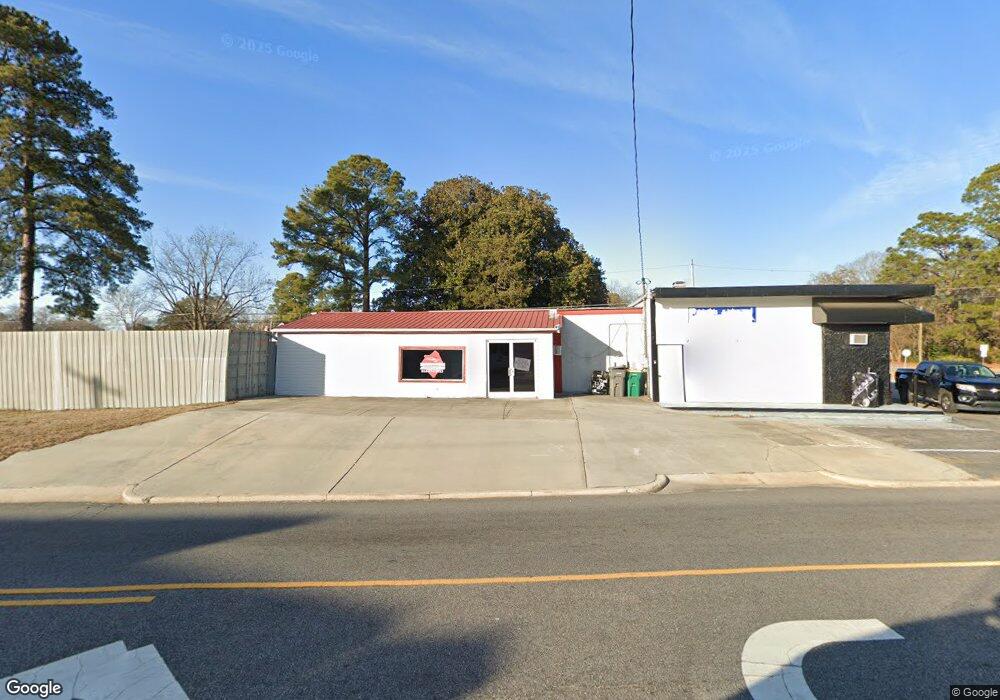
1107 E 2nd St Lumberton, NC 28358
Estimated Value: $448,134
Studio
--
Bath
855
Sq Ft
$524/Sq Ft
Est. Value
About This Home
This home is located at 1107 E 2nd St, Lumberton, NC 28358 and is currently estimated at $448,134, approximately $524 per square foot. 1107 E 2nd St is a home located in Robeson County with nearby schools including Rowland Norment Elementary School, Parkton Elementary School, and L. Gilbert Carroll Middle School.
Ownership History
Date
Name
Owned For
Owner Type
Purchase Details
Closed on
Dec 30, 2020
Sold by
Cox Tommy L and Cox Penny L
Bought by
Albarati Enan and Albarati Imran
Current Estimated Value
Home Financials for this Owner
Home Financials are based on the most recent Mortgage that was taken out on this home.
Original Mortgage
$220,000
Outstanding Balance
$77,993
Interest Rate
2.7%
Mortgage Type
Seller Take Back
Estimated Equity
$370,141
Purchase Details
Closed on
Feb 8, 2005
Sold by
Young Sammy David and Young Kathie Faye S
Bought by
Cox Tommy
Create a Home Valuation Report for This Property
The Home Valuation Report is an in-depth analysis detailing your home's value as well as a comparison with similar homes in the area
Purchase History
| Date | Buyer | Sale Price | Title Company |
|---|---|---|---|
| Albarati Enan | $270,000 | Chicago Title Insurance Co | |
| Cox Tommy | $90,000 | -- |
Source: Public Records
Mortgage History
| Date | Status | Borrower | Loan Amount |
|---|---|---|---|
| Open | Albarati Enan | $220,000 |
Source: Public Records
Tax History
| Year | Tax Paid | Tax Assessment Tax Assessment Total Assessment is a certain percentage of the fair market value that is determined by local assessors to be the total taxable value of land and additions on the property. | Land | Improvement |
|---|---|---|---|---|
| 2025 | $895 | $108,700 | $55,000 | $53,700 |
| 2024 | $890 | $108,700 | $55,000 | $53,700 |
| 2023 | $823 | $99,300 | $50,000 | $49,300 |
| 2022 | $823 | $99,300 | $50,000 | $49,300 |
| 2021 | $823 | $99,300 | $50,000 | $49,300 |
| 2020 | $808 | $99,300 | $50,000 | $49,300 |
| 2018 | $825 | $120,400 | $64,400 | $56,000 |
| 2017 | $987 | $120,400 | $64,400 | $56,000 |
| 2016 | $987 | $120,400 | $64,400 | $56,000 |
| 2015 | $987 | $120,400 | $64,400 | $56,000 |
| 2014 | $987 | $120,400 | $64,400 | $56,000 |
Source: Public Records
Map
Nearby Homes
- 1009 E 6th St
- 00 7th St
- 1418 E 6th St
- 1310 E 11th St
- 1407 Vance Dr
- 108 High St
- 1301 N Pine St
- 509 E 15th St
- 1201 N Walnut St
- 511 Lafayette St
- 0 E 9th St
- 0 Warwick Mill Rd
- 604 Middle St
- 501 Roberts Rd
- 1103 N Elm St
- 1209 N Elm St
- 1005 N Water St
- 202 E 17th St
- 0 Nc 211 Hwy Unit 654809
- 0 Nc 211 Hwy Unit 738494
Your Personal Tour Guide
Ask me questions while you tour the home.