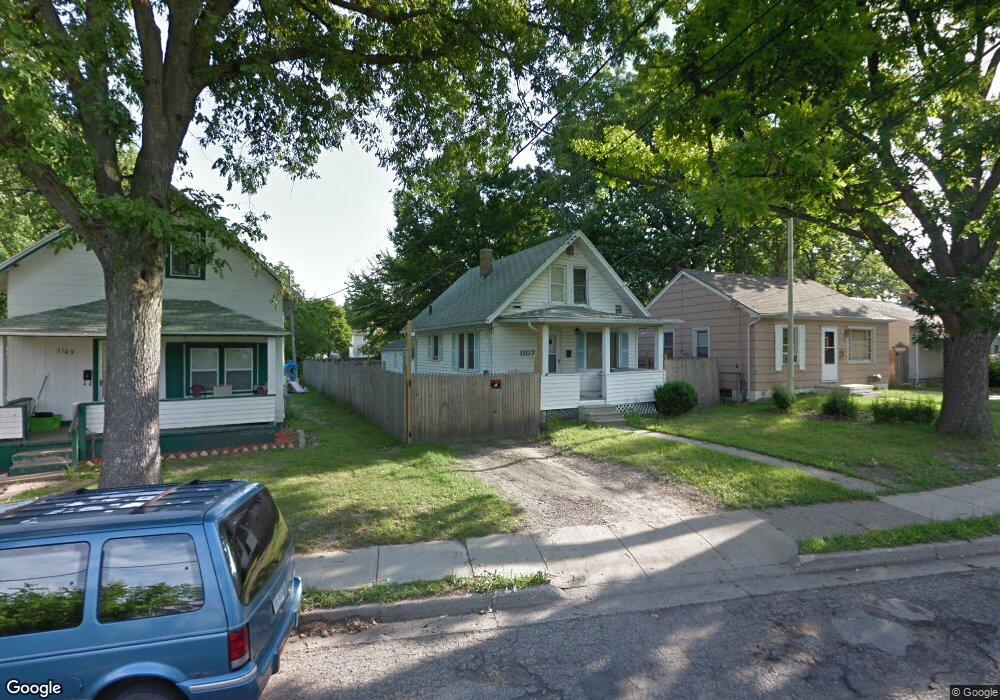
1107 Euclid Place Lansing, MI 48912
Hunter Park NeighborhoodEstimated Value: $76,000 - $110,000
2
Beds
1
Bath
1,506
Sq Ft
$57/Sq Ft
Est. Value
About This Home
This home is located at 1107 Euclid Place, Lansing, MI 48912 and is currently estimated at $86,073, approximately $57 per square foot. 1107 Euclid Place is a home located in Ingham County with nearby schools including Pattengill Academy, Riddle Elementary School, and Eastern High School.
Ownership History
Date
Name
Owned For
Owner Type
Purchase Details
Closed on
Mar 14, 2016
Sold by
Sheets David W
Bought by
D W Sheet Iii Llc
Current Estimated Value
Purchase Details
Closed on
Feb 24, 2012
Sold by
Jpmorgan Chase Bank Na
Bought by
Homesales Inc
Purchase Details
Closed on
Jul 21, 2011
Sold by
Place Holly D and Hilyard Linda C
Bought by
Jpmorgan Chase Bank Na
Purchase Details
Closed on
May 13, 2005
Sold by
Young David M and Hilyard Linda C
Bought by
Place Holly D and Hilyard Linda C
Purchase Details
Closed on
Apr 26, 2002
Sold by
Young David M
Bought by
Phelps Young Linda C
Create a Home Valuation Report for This Property
The Home Valuation Report is an in-depth analysis detailing your home's value as well as a comparison with similar homes in the area
Home Values in the Area
Average Home Value in this Area
Purchase History
| Date | Buyer | Sale Price | Title Company |
|---|---|---|---|
| D W Sheet Iii Llc | -- | None Available | |
| Homesales Inc | -- | None Available | |
| Jpmorgan Chase Bank Na | $10,836 | None Available | |
| Place Holly D | -- | -- | |
| Phelps Young Linda C | -- | -- |
Source: Public Records
Tax History Compared to Growth
Tax History
| Year | Tax Paid | Tax Assessment Tax Assessment Total Assessment is a certain percentage of the fair market value that is determined by local assessors to be the total taxable value of land and additions on the property. | Land | Improvement |
|---|---|---|---|---|
| 2025 | $1,604 | $34,600 | $3,500 | $31,100 |
| 2024 | $13 | $30,200 | $3,500 | $26,700 |
| 2023 | $1,512 | $24,800 | $3,500 | $21,300 |
| 2022 | $1,384 | $21,800 | $2,900 | $18,900 |
| 2021 | $1,352 | $19,800 | $3,900 | $15,900 |
| 2020 | $1,342 | $18,400 | $3,900 | $14,500 |
| 2019 | $1,294 | $17,700 | $3,900 | $13,800 |
| 2018 | $1,230 | $15,200 | $3,900 | $11,300 |
| 2017 | $1,182 | $15,200 | $3,900 | $11,300 |
| 2016 | $1,174 | $15,000 | $3,900 | $11,100 |
| 2015 | $1,174 | $14,700 | $7,797 | $6,903 |
| 2014 | $1,174 | $15,000 | $8,187 | $6,813 |
Source: Public Records
Map
Nearby Homes
- 1100 Hickory St
- 1128 Hickory St
- 1201 Climax St
- 910 S Holmes St
- 1212 Climax St
- 917 E Kalamazoo St
- 816 Hickory St
- 911 E Kalamazoo St
- 309 & 311 S Holmes St
- 1024 Eureka St
- 226 S 8th St
- V/L E Kalamazoo St
- 523 Clifford St
- 212 S 8th St
- 506 S East St
- 1224 Walsh St
- 209 S Hosmer St
- 207 S Hosmer St
- 400 Lathrop St
- 1019 Dakin St
- 1105 Euclid Place
- 1111 Larned St
- 1115 Larned St
- 1101 Euclid Place
- 1117 Larned St
- 1104 Bement St
- 1112 Bement St
- 1121 Larned St
- 1118 Bement St
- 1122 Bement St
- 1028 Bement St
- 1028 Bement St
- 1028 Bement St Unit A
- 1028 Bement St Unit B
- 612 Jones St
- 1022 Bement St
- 1025 Euclid Place
- 1124 Bement St
- 1020 Bement St
- 1128 Bement St