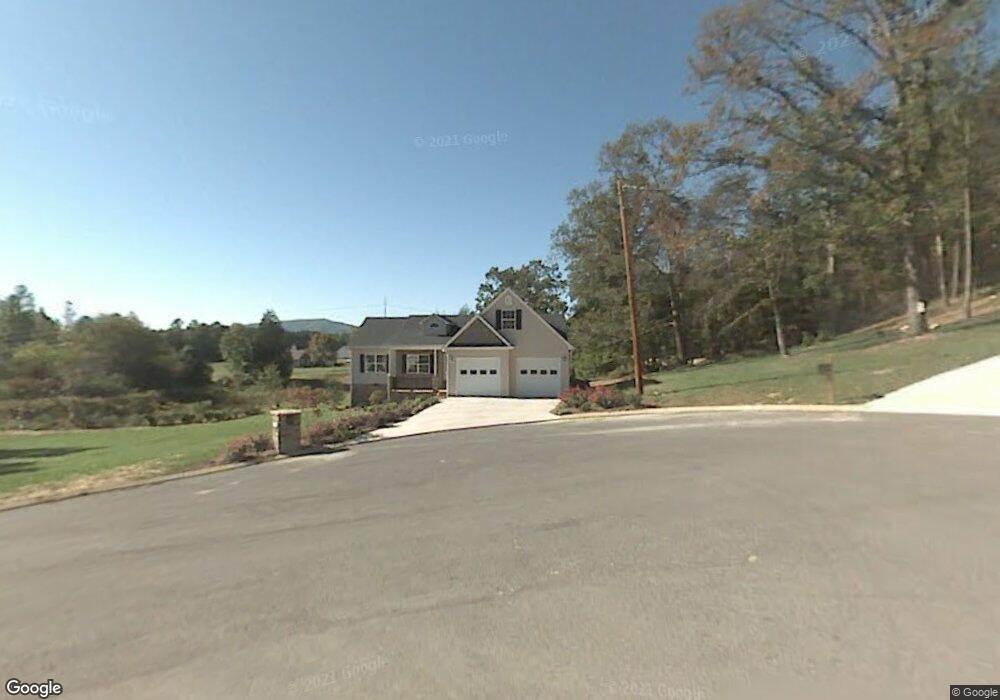
1107 Grant Way Rocky Face, GA 30740
Estimated Value: $333,844 - $386,000
4
Beds
3
Baths
2,240
Sq Ft
$162/Sq Ft
Est. Value
About This Home
This home is located at 1107 Grant Way, Rocky Face, GA 30740 and is currently estimated at $362,961, approximately $162 per square foot. 1107 Grant Way is a home located in Whitfield County with nearby schools including Westside Elementary School, Westside Middle School, and Northwest Whitfield County High School.
Ownership History
Date
Name
Owned For
Owner Type
Purchase Details
Closed on
Apr 28, 2010
Sold by
Millican Deborah L
Bought by
Millican Deborah L
Current Estimated Value
Home Financials for this Owner
Home Financials are based on the most recent Mortgage that was taken out on this home.
Original Mortgage
$186,558
Outstanding Balance
$127,292
Interest Rate
5.5%
Mortgage Type
FHA
Estimated Equity
$235,669
Purchase Details
Closed on
Apr 14, 2010
Sold by
Keel Chad
Bought by
Millican Deborah L
Home Financials for this Owner
Home Financials are based on the most recent Mortgage that was taken out on this home.
Original Mortgage
$186,558
Outstanding Balance
$127,292
Interest Rate
5.5%
Mortgage Type
FHA
Estimated Equity
$235,669
Purchase Details
Closed on
May 31, 2006
Sold by
Voyles William Chris
Bought by
Keel Chad
Purchase Details
Closed on
Aug 4, 2005
Sold by
Not Provided
Bought by
Millican Deborah L and Rayner David
Create a Home Valuation Report for This Property
The Home Valuation Report is an in-depth analysis detailing your home's value as well as a comparison with similar homes in the area
Home Values in the Area
Average Home Value in this Area
Purchase History
| Date | Buyer | Sale Price | Title Company |
|---|---|---|---|
| Millican Deborah L | -- | -- | |
| Millican Deborah L | -- | -- | |
| Millican Deborah L | $190,000 | -- | |
| Keel Chad | $188,000 | -- | |
| Millican Deborah L | $20,000 | -- |
Source: Public Records
Mortgage History
| Date | Status | Borrower | Loan Amount |
|---|---|---|---|
| Open | Millican Deborah L | $186,558 |
Source: Public Records
Tax History Compared to Growth
Tax History
| Year | Tax Paid | Tax Assessment Tax Assessment Total Assessment is a certain percentage of the fair market value that is determined by local assessors to be the total taxable value of land and additions on the property. | Land | Improvement |
|---|---|---|---|---|
| 2024 | $808 | $129,350 | $19,200 | $110,150 |
| 2023 | $1,297 | $90,684 | $10,800 | $79,884 |
| 2022 | $993 | $80,390 | $9,660 | $70,730 |
| 2021 | $994 | $80,390 | $9,660 | $70,730 |
| 2020 | $735 | $69,904 | $8,400 | $61,504 |
| 2019 | $760 | $69,904 | $8,400 | $61,504 |
| 2018 | $785 | $69,904 | $8,400 | $61,504 |
| 2017 | $1,911 | $69,904 | $8,400 | $61,504 |
| 2016 | $1,682 | $64,338 | $8,400 | $55,938 |
| 2014 | $1,533 | $64,338 | $8,400 | $55,938 |
| 2013 | -- | $64,338 | $8,400 | $55,938 |
Source: Public Records
Map
Nearby Homes
- Lot 28 Highland Cir
- Lot 21 Highland Cir
- Lot 20 Highland Cir
- Lot 29 Highland Cir
- 4 Lots Highland Cir
- 3023 Highland Cir
- 0 Plum St Unit 10493446
- 0 Plum St Unit 7553901
- Lot 20 Plum St
- 0 Bluff View Trace
- 1060 Pear St
- 0 Lamory Ln Unit 10422540
- 0 Lamory Ln Unit 7494272
- 2020 Deer Crossing
- 220 Windy Hill Dr
- 3915 Hurricane Rd
- 257 Old Babb Rd
- 815 Battlefield Park Dr
- Lot 11 Bald Eagle Ln
- Lot 12 Bald Eagle Ln
- 1109 Grant Way
- 2006 Rolling Hills Way
- 1101 Grant Way
- 1108 Grant Way
- 1104 Grant Way
- 2010 Rolling Hills Way
- 1100 Grant Way
- 2001 Rolling Hills Way
- 25 Highland Cir
- 26 Highland Cir
- 3150 Highland Cir
- 2014 Rolling Hills Way
- 1396 Mill Creek Rd
- 1392 Mill Creek Rd
- 2005 Rolling Hill Way
- 2005 Rolling Hills Way
- 2018 Rolling Hills Way
- 3215 Highland Cir
- LOT # 12 Highland Cir Unit 12
- LOT # 15 Highland Cir