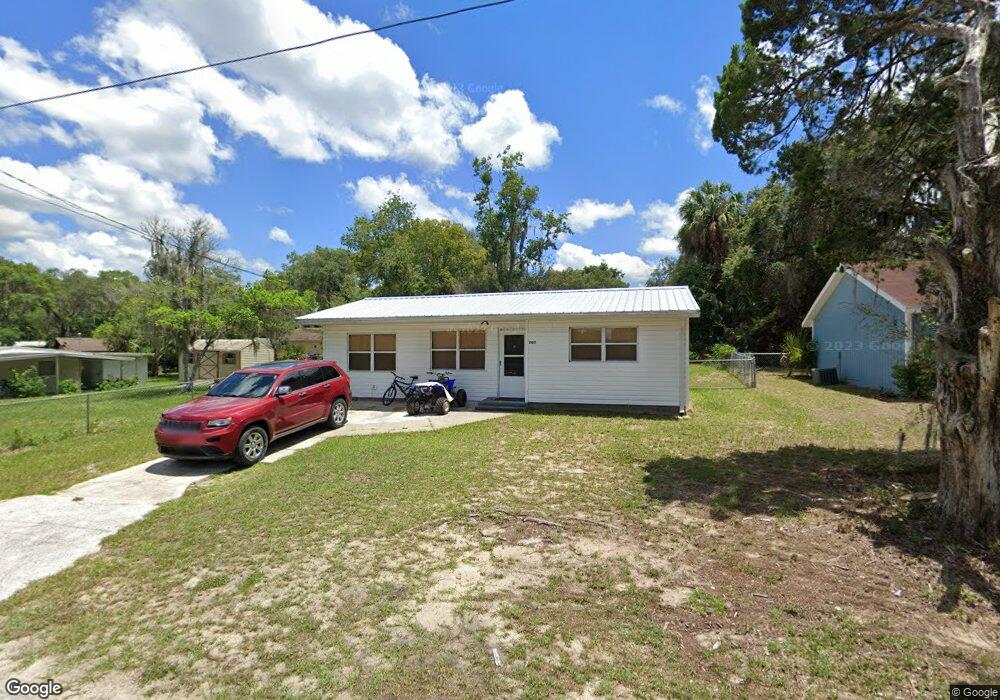
1107 Hillside Ct Inverness, FL 34450
Estimated Value: $143,000 - $156,488
2
Beds
1
Bath
864
Sq Ft
$175/Sq Ft
Est. Value
About This Home
This home is located at 1107 Hillside Ct, Inverness, FL 34450 and is currently estimated at $151,496, approximately $175 per square foot. 1107 Hillside Ct is a home located in Citrus County with nearby schools including Inverness Primary School, Inverness Middle School, and Citrus High School.
Ownership History
Date
Name
Owned For
Owner Type
Purchase Details
Closed on
Jul 6, 2013
Sold by
Ralston Ralph E and Ralston Erlinda S
Bought by
Miller Willie S and Miller Michelle A
Current Estimated Value
Purchase Details
Closed on
Jul 1, 2013
Bought by
Miller Willie S and Miller Michelle A
Purchase Details
Closed on
Sep 14, 2010
Sold by
Ralston Ralph Edward and Ralston Erlinda S
Bought by
Ralston Ralph E and Ralston Erlinda S
Purchase Details
Closed on
Sep 1, 2010
Bought by
Miller Willie S and Miller Michelle A
Purchase Details
Closed on
Apr 28, 2010
Sold by
Bauer Daniel F and Bauer Mary Gayle
Bought by
Ralston Ralph Edward and Ralston Erlinda S
Purchase Details
Closed on
May 11, 2006
Sold by
Edwards Construction Services Inc
Bought by
Bauer Daniel F and Bauer Mary Gayle
Purchase Details
Closed on
Jan 1, 1993
Bought by
Miller Willie S and Miller Michelle A
Purchase Details
Closed on
Jan 1, 1990
Bought by
Miller Willie S and Miller Michelle A
Create a Home Valuation Report for This Property
The Home Valuation Report is an in-depth analysis detailing your home's value as well as a comparison with similar homes in the area
Home Values in the Area
Average Home Value in this Area
Purchase History
| Date | Buyer | Sale Price | Title Company |
|---|---|---|---|
| Miller Willie S | -- | None Available | |
| Miller Willie S | $100 | -- | |
| Ralston Ralph E | -- | None Available | |
| Miller Willie S | $100 | -- | |
| Ralston Ralph Edward | $26,000 | North Central Fl Title Llc | |
| Bauer Daniel F | $32,900 | Attorney | |
| Miller Willie S | $32,500 | -- | |
| Miller Willie S | $31,700 | -- |
Source: Public Records
Tax History
| Year | Tax Paid | Tax Assessment Tax Assessment Total Assessment is a certain percentage of the fair market value that is determined by local assessors to be the total taxable value of land and additions on the property. | Land | Improvement |
|---|---|---|---|---|
| 2025 | $863 | $79,106 | -- | -- |
| 2024 | $832 | $71,011 | -- | -- |
| 2023 | $832 | $53,950 | $0 | $0 |
| 2022 | $707 | $61,429 | $0 | $0 |
| 2021 | $584 | $47,033 | $0 | $0 |
| 2020 | $544 | $49,891 | $3,480 | $46,411 |
| 2019 | $935 | $41,869 | $3,360 | $38,509 |
| 2018 | $0 | $41,764 | $2,610 | $39,154 |
| 2017 | $0 | $23,318 | $2,610 | $20,708 |
| 2016 | $0 | $22,838 | $1,940 | $20,898 |
| 2015 | -- | $21,577 | $1,940 | $19,637 |
| 2014 | -- | $21,406 | $3,167 | $18,239 |
Source: Public Records
Map
Nearby Homes
- 1104 Lake Shore Dr
- 509 Henson Point
- 475 Landing Blvd
- 1403 Lakeshore Dr
- 1406 Eden Dr
- 1221 Emerson St
- 1505 Lakeview Dr
- 729 Longfellow Terrace
- 822 Poplar St
- 1221 Poe St
- 3118 S Florida Ave
- 1206 Cypress Cove Ct Unit 6
- 1206 Cypress Cove Ct Unit 22
- 916 Pineaire St
- 725 Kingsley Terrace
- 1288 Cypress Cove Ct
- 1340 Cypress Cove Ct
- 907 Pineaire St
- 1282 Cypress Cove Ct
- 916 Spruce St
- 1105 Hillside Ct
- 1109 Hillside Ct
- 1108 Knob Hill St
- 1101 Hillside Ct
- 1108 Hillside Ct
- 1104 Hillside Ct
- 1112 Knob Hill St
- 1116 Hillside Ct
- 0 Hillside Ct
- 1100 Hillside Ct
- 1116 Lakeshore Dr
- 1202 Lakeshore Dr
- 1105 Knob Hill St
- 1109 Knob Hill St
- 1112 Lakeshore Dr
- 1013 Knob Hill St
- 602 Lakewood Dr
- 1108 Lakeshore Dr
- 1011 Knob Hill St
Your Personal Tour Guide
Ask me questions while you tour the home.