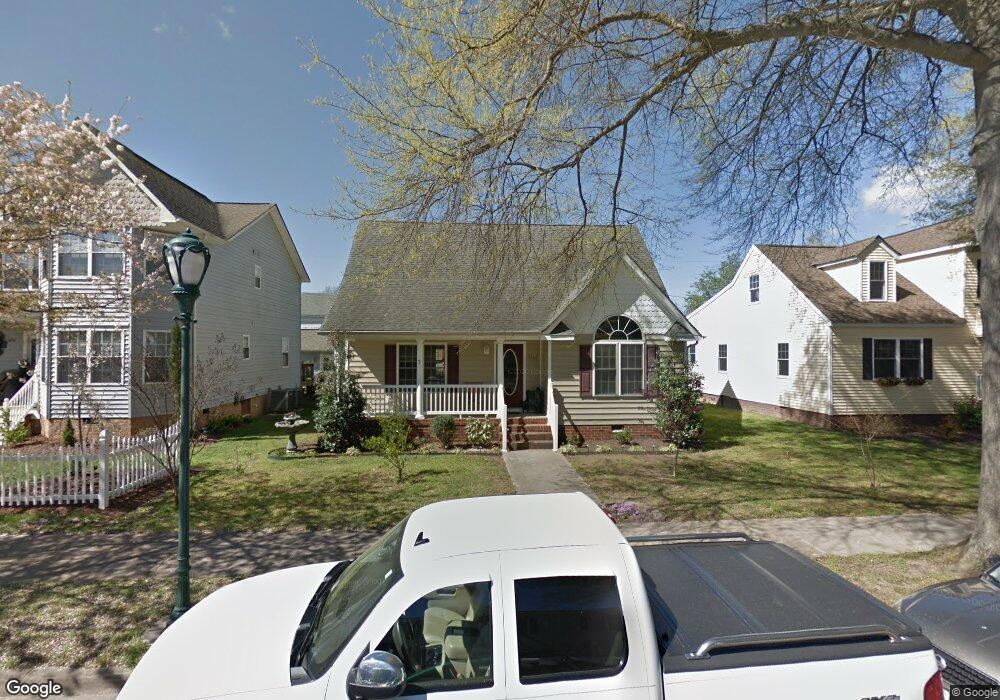
1107 Main St West Point, VA 23181
Estimated Value: $291,613 - $337,000
3
Beds
2
Baths
1,489
Sq Ft
$207/Sq Ft
Est. Value
About This Home
This home is located at 1107 Main St, West Point, VA 23181 and is currently estimated at $308,903, approximately $207 per square foot. 1107 Main St is a home located in King William County with nearby schools including West Point Elementary School, West Point Middle School, and West Point High School.
Ownership History
Date
Name
Owned For
Owner Type
Purchase Details
Closed on
Jul 5, 2005
Sold by
Liggan Homes Inc
Bought by
Thompson Susan J
Current Estimated Value
Home Financials for this Owner
Home Financials are based on the most recent Mortgage that was taken out on this home.
Original Mortgage
$95,000
Outstanding Balance
$49,815
Interest Rate
5.73%
Mortgage Type
New Conventional
Estimated Equity
$259,088
Purchase Details
Closed on
Feb 8, 2005
Sold by
Britt John B
Bought by
Liggan Homes Inc
Purchase Details
Closed on
Jan 21, 2005
Sold by
Harris James H
Bought by
Britt John B
Create a Home Valuation Report for This Property
The Home Valuation Report is an in-depth analysis detailing your home's value as well as a comparison with similar homes in the area
Home Values in the Area
Average Home Value in this Area
Purchase History
| Date | Buyer | Sale Price | Title Company |
|---|---|---|---|
| Thompson Susan J | $169,900 | -- | |
| Liggan Homes Inc | $26,000 | -- | |
| Britt John B | $10,000 | -- |
Source: Public Records
Mortgage History
| Date | Status | Borrower | Loan Amount |
|---|---|---|---|
| Open | Britt John B | $95,000 |
Source: Public Records
Tax History
| Year | Tax Paid | Tax Assessment Tax Assessment Total Assessment is a certain percentage of the fair market value that is determined by local assessors to be the total taxable value of land and additions on the property. | Land | Improvement |
|---|---|---|---|---|
| 2025 | $665 | $217,900 | $30,000 | $187,900 |
| 2024 | $588 | $217,900 | $30,000 | $187,900 |
| 2023 | $588 | $217,900 | $30,000 | $187,900 |
| 2022 | $534 | $142,400 | $30,000 | $112,400 |
| 2021 | $541 | $142,400 | $30,000 | $112,400 |
| 2020 | $541 | $190,100 | $27,000 | $163,100 |
| 2019 | $541 | $141,900 | $30,000 | $111,900 |
| 2018 | $555 | $142,400 | $30,000 | $112,400 |
| 2017 | $577 | $142,400 | $30,000 | $112,400 |
| 2016 | $584 | $142,400 | $30,000 | $112,400 |
| 2015 | $612 | $142,400 | $30,000 | $112,400 |
| 2014 | $663 | $0 | $0 | $0 |
Source: Public Records
Map
Nearby Homes
Your Personal Tour Guide
Ask me questions while you tour the home.