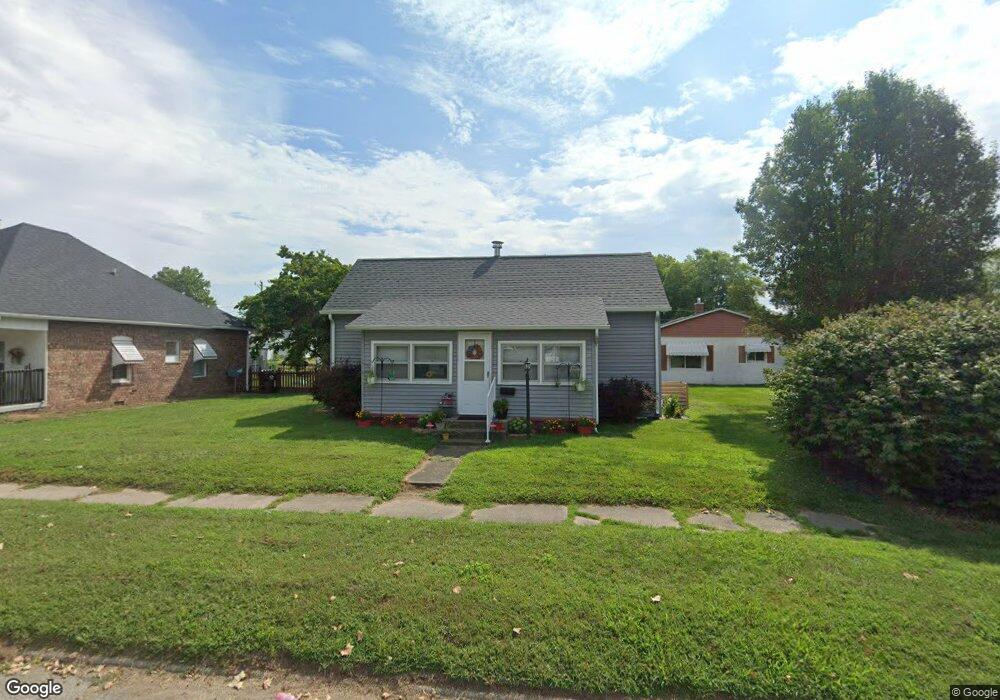
1107 N 9th St Clinton, IN 47842
Estimated Value: $82,000 - $124,000
3
Beds
1
Bath
960
Sq Ft
$105/Sq Ft
Est. Value
About This Home
This home is located at 1107 N 9th St, Clinton, IN 47842 and is currently estimated at $100,355, approximately $104 per square foot. 1107 N 9th St is a home located in Vermillion County with nearby schools including South Vermillion High School and Sacred Heart School.
Ownership History
Date
Name
Owned For
Owner Type
Purchase Details
Closed on
Sep 5, 2024
Sold by
Hart Randy and Hart Sharon
Bought by
Freed Deanna M
Current Estimated Value
Purchase Details
Closed on
Sep 3, 2024
Sold by
Branam Leanne E
Bought by
Hart Randy and Hart Sharon
Purchase Details
Closed on
Aug 8, 2023
Sold by
Hart Randy and Hart Sharon
Bought by
Branam Leanne E
Purchase Details
Closed on
Oct 22, 2008
Sold by
Mcdowell Robert M
Bought by
Hart Randy and Hart Sharon
Create a Home Valuation Report for This Property
The Home Valuation Report is an in-depth analysis detailing your home's value as well as a comparison with similar homes in the area
Home Values in the Area
Average Home Value in this Area
Purchase History
| Date | Buyer | Sale Price | Title Company |
|---|---|---|---|
| Freed Deanna M | $80,000 | None Listed On Document | |
| Freed Deanna M | $80,000 | None Listed On Document | |
| Hart Randy | -- | None Listed On Document | |
| Hart Randy | -- | None Listed On Document | |
| Branam Leanne E | $80,000 | None Listed On Document | |
| Hart Randy | $25,500 | -- | |
| Randy Hart | $25,500 | Antonini & Antonini |
Source: Public Records
Tax History
| Year | Tax Paid | Tax Assessment Tax Assessment Total Assessment is a certain percentage of the fair market value that is determined by local assessors to be the total taxable value of land and additions on the property. | Land | Improvement |
|---|---|---|---|---|
| 2025 | $655 | $81,700 | $13,100 | $68,600 |
| 2024 | $655 | $73,900 | $13,100 | $60,800 |
| 2023 | $649 | $69,300 | $13,100 | $56,200 |
| 2022 | $1,347 | $67,000 | $13,100 | $53,900 |
| 2021 | $1,235 | $61,400 | $13,100 | $48,300 |
| 2020 | $1,081 | $53,800 | $16,300 | $37,500 |
| 2019 | $770 | $38,500 | $7,400 | $31,100 |
| 2018 | $774 | $38,700 | $7,400 | $31,300 |
| 2017 | $766 | $38,300 | $7,400 | $30,900 |
| 2016 | $748 | $37,400 | $7,400 | $30,000 |
| 2014 | $722 | $36,100 | $7,400 | $28,700 |
| 2013 | $722 | $36,300 | $7,400 | $28,900 |
Source: Public Records
Map
Nearby Homes
Your Personal Tour Guide
Ask me questions while you tour the home.