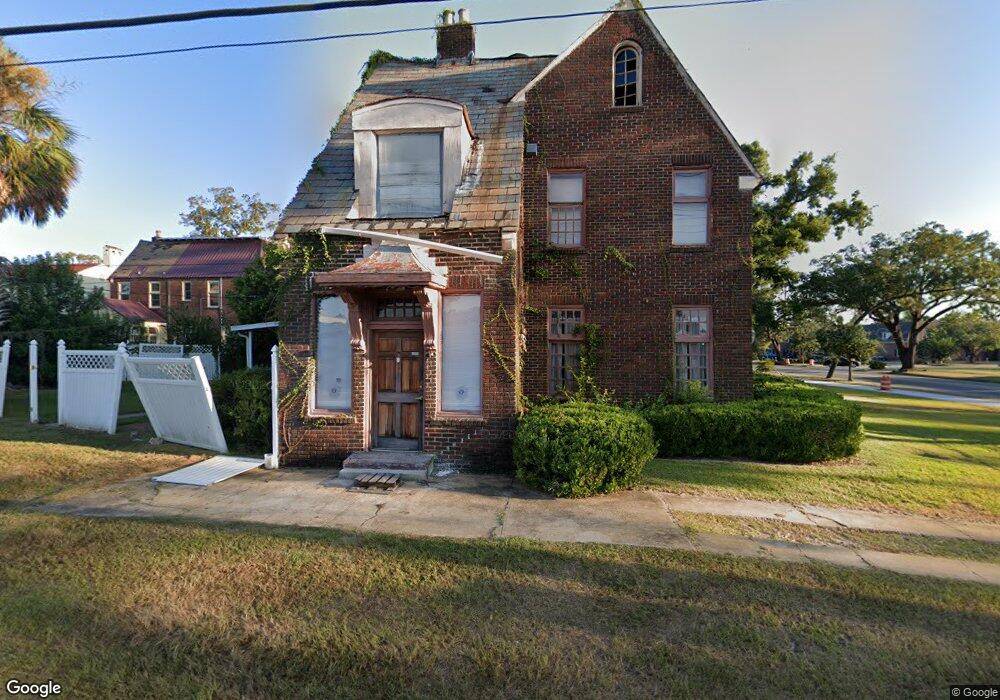
1107 N Jefferson St Albany, GA 31701
Albany Historic District NeighborhoodEstimated Value: $170,000 - $261,000
3
Beds
3
Baths
3,742
Sq Ft
$55/Sq Ft
Est. Value
About This Home
This home is located at 1107 N Jefferson St, Albany, GA 31701 and is currently estimated at $206,899, approximately $55 per square foot. 1107 N Jefferson St is a home located in Dougherty County with nearby schools including Northside Elementary School, Albany Middle School, and Albany High School.
Ownership History
Date
Name
Owned For
Owner Type
Purchase Details
Closed on
Jan 12, 2007
Sold by
Action Captial
Bought by
Lanier Ray B
Current Estimated Value
Purchase Details
Closed on
Aug 14, 2006
Sold by
Lanier Raiford J
Bought by
Lanier Ray Berry and Lanier Raiford Jimmie
Purchase Details
Closed on
Jun 6, 1984
Sold by
Lanier Ray Berry
Bought by
Lanier Raiford and Lanier Bet
Create a Home Valuation Report for This Property
The Home Valuation Report is an in-depth analysis detailing your home's value as well as a comparison with similar homes in the area
Home Values in the Area
Average Home Value in this Area
Purchase History
| Date | Buyer | Sale Price | Title Company |
|---|---|---|---|
| Lanier Ray B | -- | -- | |
| Lanier Ray Berry | -- | -- | |
| Lanier Raiford | -- | -- |
Source: Public Records
Tax History Compared to Growth
Tax History
| Year | Tax Paid | Tax Assessment Tax Assessment Total Assessment is a certain percentage of the fair market value that is determined by local assessors to be the total taxable value of land and additions on the property. | Land | Improvement |
|---|---|---|---|---|
| 2024 | $2,515 | $52,720 | $6,320 | $46,400 |
| 2023 | $2,456 | $52,720 | $6,320 | $46,400 |
| 2022 | $2,465 | $52,720 | $6,320 | $46,400 |
| 2021 | $2,286 | $52,720 | $6,320 | $46,400 |
| 2020 | $2,291 | $52,720 | $6,320 | $46,400 |
| 2019 | $2,300 | $52,720 | $6,320 | $46,400 |
| 2018 | $2,309 | $52,720 | $6,320 | $46,400 |
| 2017 | $2,151 | $52,720 | $6,320 | $46,400 |
| 2016 | $2,153 | $52,720 | $6,320 | $46,400 |
| 2015 | $1,882 | $52,720 | $6,320 | $46,400 |
| 2014 | $1,990 | $56,080 | $9,680 | $46,400 |
Source: Public Records
Map
Nearby Homes
- 305 6th Ave
- 303 6th Ave
- 910 N Jackson St
- 804 N Jefferson St
- 1207 N Madison St
- 610 W 2nd Ave
- 526 10th Ave
- 1107 N Davis St
- 631 W 3rd Ave
- 903 N Davis St
- 507 N Jackson St
- 711 W 2nd Ave
- 634 11th Ave
- 707 8th Ave
- 703 9th Ave
- 800 7th Ave
- 717 8th Ave
- 714 9th Ave
- 1640 Arlington Park Cir
- 1648 Arlington Park Cir