Estimated Value: $98,000 - $149,000
3
Beds
1
Bath
1,202
Sq Ft
$100/Sq Ft
Est. Value
About This Home
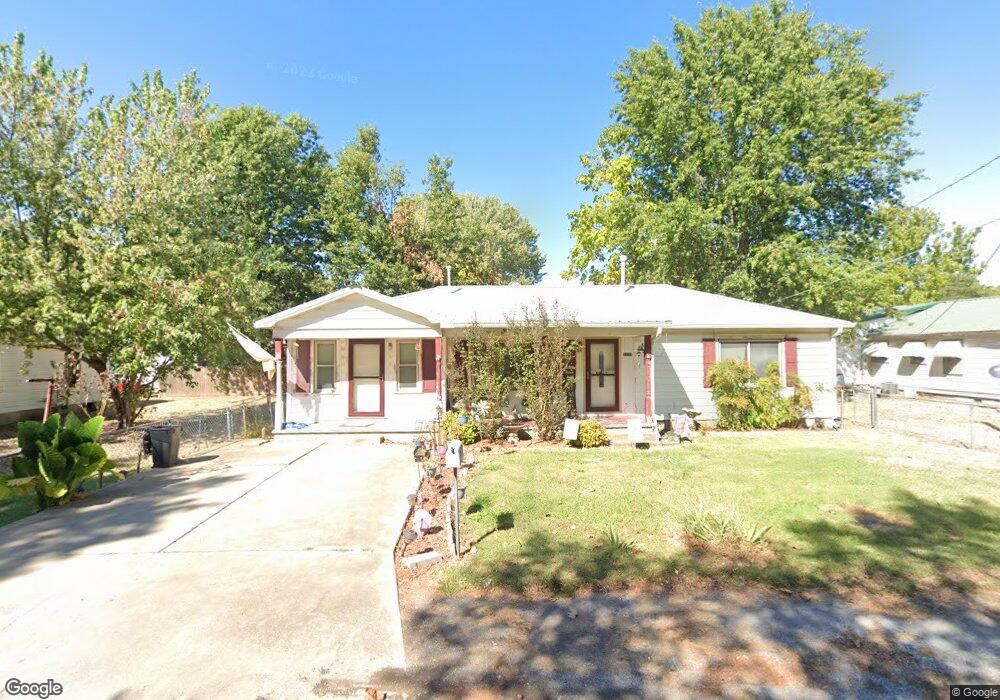
This home is located at 1107 NE 2nd Place, Pryor, OK 74361 and is currently estimated at $120,453, approximately $100 per square foot. 1107 NE 2nd Place is a home located in Mayes County with nearby schools including Pryor Middle School, Pryor High School, and William Bradford Christian School.
Ownership History
Date
Name
Owned For
Owner Type
Purchase Details
Closed on
Sep 1, 2006
Sold by
Ckm Properties Llc
Bought by
Foster Larry E and Foster Doris M
Current Estimated Value
Home Financials for this Owner
Home Financials are based on the most recent Mortgage that was taken out on this home.
Original Mortgage
$60,200
Outstanding Balance
$36,015
Interest Rate
6.79%
Mortgage Type
New Conventional
Estimated Equity
$84,438
Purchase Details
Closed on
Feb 11, 2004
Sold by
Chase Manhattan
Bought by
Ckm Properties
Purchase Details
Closed on
Jan 21, 2003
Sold by
Ttillerson Donald and Ttillerson Arwana
Bought by
Chase Manhattan Morgt
Purchase Details
Closed on
Jul 19, 2001
Sold by
Tri-County Builders
Bought by
Tillerson Donald and Tillerson Arwanna
Purchase Details
Closed on
Dec 8, 1995
Sold by
Jackson Theresa A
Bought by
Tri-County Builders
Purchase Details
Closed on
Mar 12, 1991
Sold by
Huff Clifford
Bought by
Moore Mildred
Purchase Details
Closed on
Feb 8, 1991
Sold by
Kissinger Interest
Bought by
Huff Clifford
Create a Home Valuation Report for This Property
The Home Valuation Report is an in-depth analysis detailing your home's value as well as a comparison with similar homes in the area
Home Values in the Area
Average Home Value in this Area
Purchase History
| Date | Buyer | Sale Price | Title Company |
|---|---|---|---|
| Foster Larry E | $55,500 | Mayes County Abstract Compan | |
| Ckm Properties | $30,000 | -- | |
| Chase Manhattan Morgt | -- | -- | |
| Tillerson Donald | $55,000 | -- | |
| Tri-County Builders | $30,000 | -- | |
| Moore Mildred | $12,000 | -- | |
| Huff Clifford | $19,000 | -- |
Source: Public Records
Mortgage History
| Date | Status | Borrower | Loan Amount |
|---|---|---|---|
| Open | Foster Larry E | $60,200 |
Source: Public Records
Tax History Compared to Growth
Tax History
| Year | Tax Paid | Tax Assessment Tax Assessment Total Assessment is a certain percentage of the fair market value that is determined by local assessors to be the total taxable value of land and additions on the property. | Land | Improvement |
|---|---|---|---|---|
| 2025 | $514 | $7,303 | $2,584 | $4,719 |
| 2023 | $514 | $6,884 | $2,483 | $4,401 |
| 2022 | $475 | $6,684 | $2,477 | $4,207 |
| 2021 | $463 | $6,489 | $2,469 | $4,020 |
| 2020 | $439 | $6,300 | $2,352 | $3,948 |
| 2019 | $437 | $6,117 | $2,235 | $3,882 |
| 2018 | $419 | $5,938 | $2,100 | $3,838 |
| 2017 | $376 | $5,765 | $1,719 | $4,046 |
| 2016 | $367 | $5,597 | $1,442 | $4,155 |
| 2015 | $373 | $5,597 | $1,442 | $4,155 |
| 2014 | $390 | $5,597 | $1,442 | $4,155 |
Source: Public Records
Map
Nearby Homes
- 202 N Ora St
- 0 N Orphan St
- 201 N Indianola St
- 107 N Orphan St
- 115 N Indianola St
- 7 N Ora St
- 3 N Ora St
- 304 N Hogan St
- 201 N Coo Y Yah St
- 319 N Hogan St
- 415 N Orphan St
- 232 Eastmanor Cir
- 5 S Orphan St
- 1208 NE 5th St
- 404 N Oklahoma St
- 7 S Orphan St
- 1213 NE 5th St
- 424 N Oklahoma St
- 320 Heron Cir
- 310 N Rowe St