Estimated Value: $349,000 - $534,000
2
Beds
1
Bath
1,560
Sq Ft
$287/Sq Ft
Est. Value
About This Home
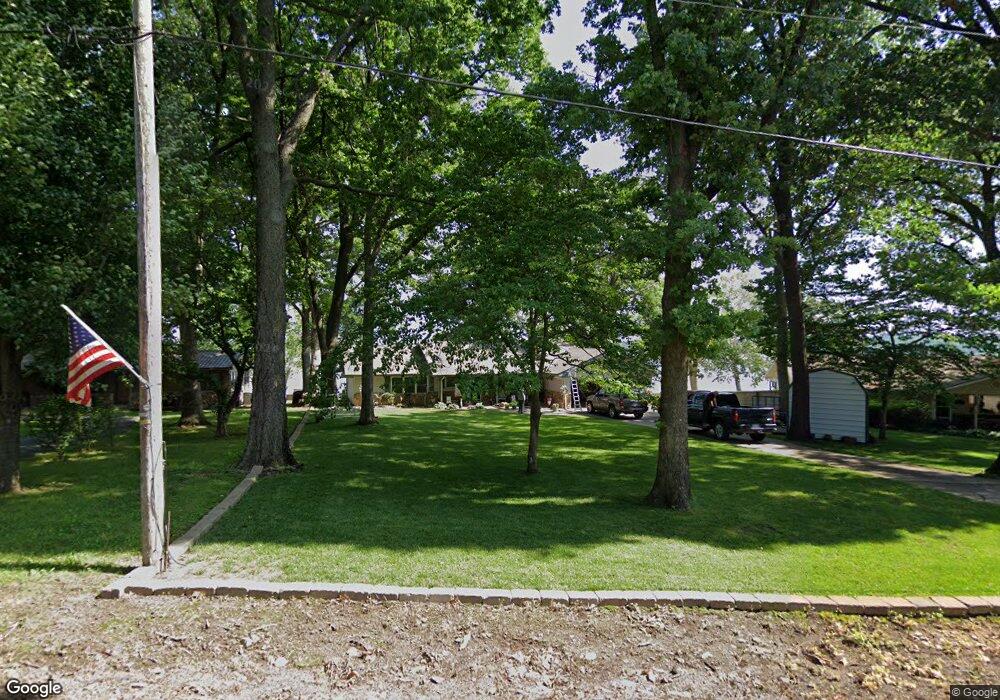
This home is located at 1107 Red Bud Dr, Grove, OK 74344 and is currently estimated at $447,984, approximately $287 per square foot. 1107 Red Bud Dr is a home located in Delaware County with nearby schools including Grove Lower Elementary School, Grove Upper Elementary School, and Grove Middle School.
Ownership History
Date
Name
Owned For
Owner Type
Purchase Details
Closed on
May 1, 2025
Sold by
Long William R and Long Ethel L
Bought by
Henderson Steve and Henderson Gina
Current Estimated Value
Purchase Details
Closed on
Aug 30, 2013
Sold by
Carter J Ron and Carter Sharon D
Bought by
Long William R and Long Ethel L
Home Financials for this Owner
Home Financials are based on the most recent Mortgage that was taken out on this home.
Original Mortgage
$130,000
Interest Rate
4.42%
Mortgage Type
New Conventional
Create a Home Valuation Report for This Property
The Home Valuation Report is an in-depth analysis detailing your home's value as well as a comparison with similar homes in the area
Home Values in the Area
Average Home Value in this Area
Purchase History
| Date | Buyer | Sale Price | Title Company |
|---|---|---|---|
| Henderson Steve | -- | None Listed On Document | |
| Henderson Steve | -- | None Listed On Document | |
| Henderson Steve | $500,000 | Grand River Abstract & Title | |
| Henderson Steve | $500,000 | Grand River Abstract & Title | |
| Long William R | $230,000 | Grand River Abstract & Title |
Source: Public Records
Mortgage History
| Date | Status | Borrower | Loan Amount |
|---|---|---|---|
| Previous Owner | Long William R | $130,000 |
Source: Public Records
Tax History Compared to Growth
Tax History
| Year | Tax Paid | Tax Assessment Tax Assessment Total Assessment is a certain percentage of the fair market value that is determined by local assessors to be the total taxable value of land and additions on the property. | Land | Improvement |
|---|---|---|---|---|
| 2025 | $2,428 | $31,917 | $13,440 | $18,477 |
| 2024 | $2,428 | $30,988 | $13,049 | $17,939 |
| 2023 | $2,428 | $30,085 | $12,959 | $17,126 |
| 2022 | $2,355 | $30,085 | $12,938 | $17,147 |
| 2021 | $2,279 | $29,209 | $12,938 | $16,271 |
| 2020 | $2,248 | $27,533 | $12,938 | $14,595 |
| 2019 | $2,223 | $27,148 | $12,938 | $14,210 |
| 2018 | $2,177 | $26,723 | $12,938 | $13,785 |
| 2017 | $2,118 | $26,463 | $12,938 | $13,525 |
| 2016 | $2,047 | $25,061 | $9,476 | $15,585 |
| 2015 | $2,077 | $25,061 | $9,476 | $15,585 |
| 2014 | $2,174 | $25,061 | $9,476 | $15,585 |
Source: Public Records
Map
Nearby Homes