1107 Riverview Ranch Brazoria, TX 77422
Estimated Value: $582,000 - $698,000
--
Bed
6
Baths
3,220
Sq Ft
$192/Sq Ft
Est. Value
About This Home
This home is located at 1107 Riverview Ranch, Brazoria, TX 77422 and is currently estimated at $619,554, approximately $192 per square foot. 1107 Riverview Ranch is a home located in Brazoria County with nearby schools including Sweeny Elementary School, Sweeny Junior High School, and Sweeny High School.
Ownership History
Date
Name
Owned For
Owner Type
Purchase Details
Closed on
Feb 7, 2003
Sold by
Kilpatrick Investments Ltd
Bought by
Forrest Lynn and Forrest Angela R
Current Estimated Value
Home Financials for this Owner
Home Financials are based on the most recent Mortgage that was taken out on this home.
Original Mortgage
$396,000
Outstanding Balance
$186,983
Interest Rate
7.5%
Estimated Equity
$432,571
Purchase Details
Closed on
Oct 29, 1999
Sold by
Johse Margaret June
Bought by
Kilpatrick Investments Ltd
Purchase Details
Closed on
Apr 24, 1998
Sold by
Bousquet Thomas G and Bousquet Rebecca B
Bought by
Johse Margaret June
Home Financials for this Owner
Home Financials are based on the most recent Mortgage that was taken out on this home.
Original Mortgage
$37,550
Interest Rate
7.21%
Mortgage Type
Seller Take Back
Create a Home Valuation Report for This Property
The Home Valuation Report is an in-depth analysis detailing your home's value as well as a comparison with similar homes in the area
Home Values in the Area
Average Home Value in this Area
Purchase History
| Date | Buyer | Sale Price | Title Company |
|---|---|---|---|
| Forrest Lynn | -- | American Title Co | |
| Kilpatrick Investments Ltd | -- | Alamo Title 03 | |
| Johse Margaret June | -- | -- |
Source: Public Records
Mortgage History
| Date | Status | Borrower | Loan Amount |
|---|---|---|---|
| Open | Forrest Lynn | $396,000 | |
| Previous Owner | Johse Margaret June | $37,550 |
Source: Public Records
Tax History Compared to Growth
Tax History
| Year | Tax Paid | Tax Assessment Tax Assessment Total Assessment is a certain percentage of the fair market value that is determined by local assessors to be the total taxable value of land and additions on the property. | Land | Improvement |
|---|---|---|---|---|
| 2025 | $5,935 | $566,500 | $200,690 | $404,310 |
| 2023 | $5,935 | $468,182 | $233,350 | $482,530 |
| 2022 | $8,199 | $425,620 | $142,000 | $283,620 |
| 2021 | $8,655 | $411,700 | $142,000 | $269,700 |
| 2020 | $8,597 | $384,430 | $131,850 | $252,580 |
| 2019 | $10,073 | $431,850 | $142,000 | $289,850 |
| 2018 | $9,070 | $393,740 | $142,000 | $251,740 |
| 2017 | $9,668 | $417,090 | $152,140 | $264,950 |
| 2016 | $9,597 | $414,000 | $143,570 | $270,430 |
| 2015 | $7,399 | $409,380 | $121,710 | $287,670 |
| 2014 | $7,399 | $405,100 | $94,280 | $310,820 |
Source: Public Records
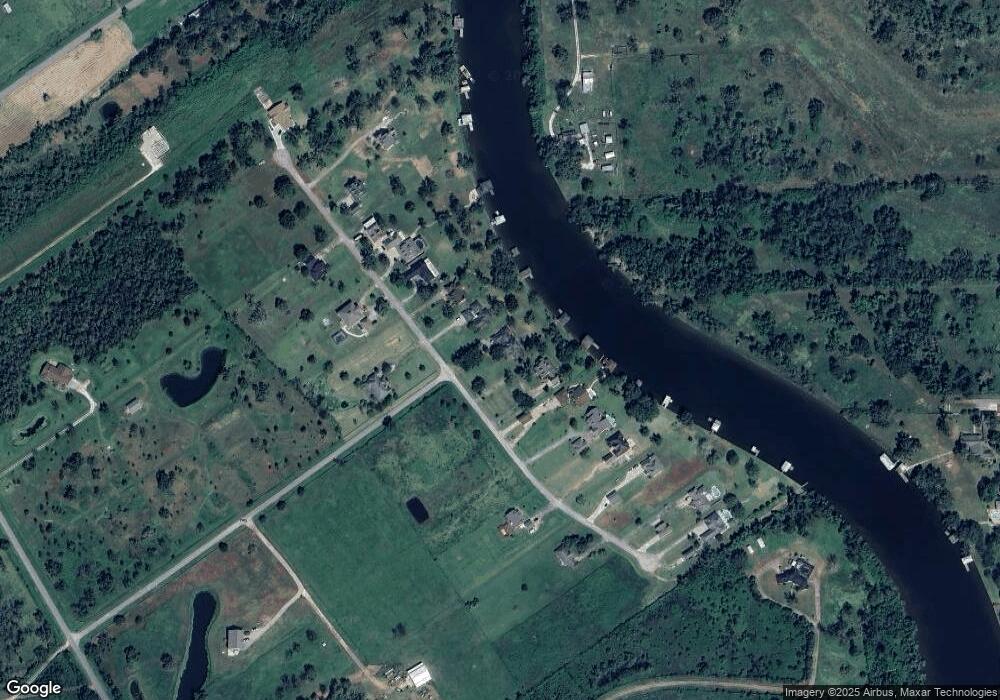
Map
Nearby Homes
- 630 Riverview Ranch Dr
- 1092 Riverview Ranch
- 307 County Road 416
- 20406 Cr 510u Rd
- 20331 County Road 510v
- 20250 County Road 510q
- 0 County Road 306 Unit 25212710
- 000 County Road 627 Nar
- 138 Vivian St
- 3042 County Road 510l
- 3032 County Road 510j
- 3127 County Road 510k
- 3146 County Road 510k
- 20310 County Road 510f
- 5031 County Road 819
- Lot 1 County Road 819
- 0 County Road 819
- 220 County Road 461a
- 0 County Road 510b
- 3418 County Road 310
- 1107 Riverview Dr
- 1075 Riverview Ranch
- 1121 Riverview Ranch
- 1121 Riverview Ranch
- 1176 Cr 630
- 1167 Riverview Ranch Dr
- 0000 Riverview Ranch Dr
- 1175 Riverview Ranch Dr
- 1006 Riverview Ranch Dr
- 1022 Riverview Ranch Dr
- 1083 Riverview Ranch
- 1135 Riverview Ranch
- 1054 Riverview Ranch Dr
- 1149 Riverview Ranch
- 1069 Riverview Ranch
- 1069 Riverview Ranch
- 1149 Riverview Ranch
- 1149 Riverview Ranch Dr
- 1053 Riverview Ranch
- 1189 Riverview Ranch