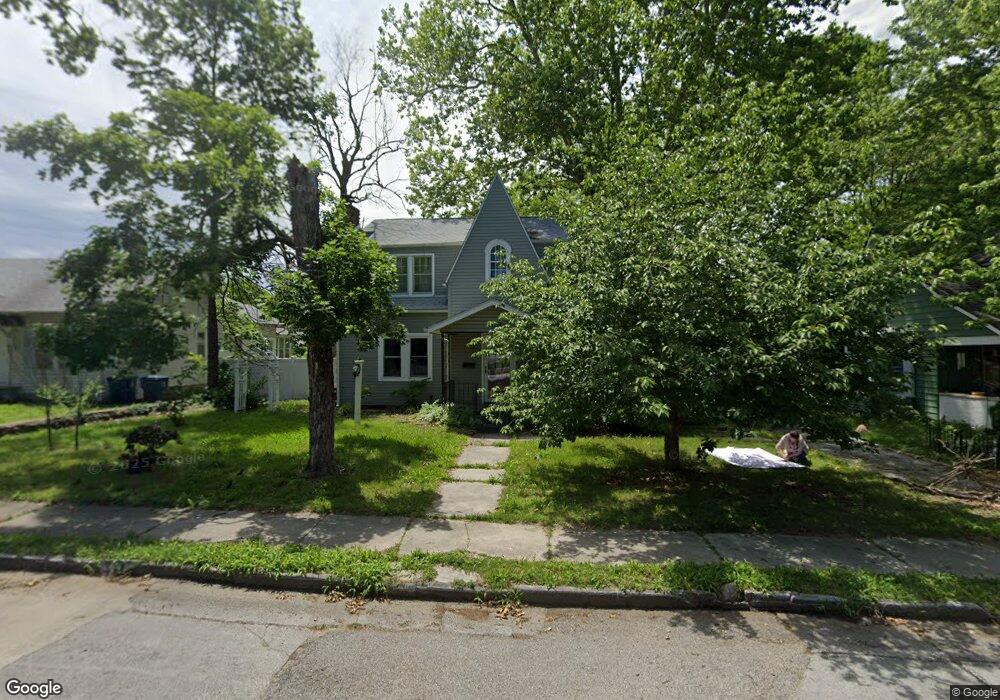
1107 S Maple St Carthage, MO 64836
Estimated Value: $225,000 - $285,000
3
Beds
2
Baths
2,894
Sq Ft
$87/Sq Ft
Est. Value
About This Home
This home is located at 1107 S Maple St, Carthage, MO 64836 and is currently estimated at $252,505, approximately $87 per square foot. 1107 S Maple St is a home located in Jasper County with nearby schools including Carthage High School, Victory Academy, and St. Ann's Catholic School.
Ownership History
Date
Name
Owned For
Owner Type
Purchase Details
Closed on
Sep 24, 2025
Sold by
Millsap & Singer Pc
Bought by
Flat Branch Mortgage Inc
Current Estimated Value
Purchase Details
Closed on
Aug 18, 2021
Sold by
Vickers Jason A and Vickers Sarah W
Bought by
Ruiz Leon V
Home Financials for this Owner
Home Financials are based on the most recent Mortgage that was taken out on this home.
Original Mortgage
$188,383
Interest Rate
2.9%
Purchase Details
Closed on
May 21, 2021
Sold by
Cameron Bradley P
Bought by
Vickers Jason A and Vickers Sarah W
Home Financials for this Owner
Home Financials are based on the most recent Mortgage that was taken out on this home.
Original Mortgage
$100,000
Interest Rate
2.9%
Mortgage Type
New Conventional
Purchase Details
Closed on
Oct 27, 2020
Sold by
Cameron Bradley P
Bought by
Cameron Bradley P and Cameron Bret F
Create a Home Valuation Report for This Property
The Home Valuation Report is an in-depth analysis detailing your home's value as well as a comparison with similar homes in the area
Home Values in the Area
Average Home Value in this Area
Purchase History
| Date | Buyer | Sale Price | Title Company |
|---|---|---|---|
| Flat Branch Mortgage Inc | $166,440 | None Listed On Document | |
| Ruiz Leon V | -- | None Listed On Document | |
| Ruiz Leon V | -- | None Listed On Document | |
| Vickers Jason A | -- | None Listed On Document | |
| Vickers Jason A | -- | None Listed On Document | |
| Cameron Bradley P | -- | None Listed On Document |
Source: Public Records
Mortgage History
| Date | Status | Borrower | Loan Amount |
|---|---|---|---|
| Previous Owner | Ruiz Leon V | $188,383 | |
| Previous Owner | Ruiz Leon V | $188,383 | |
| Previous Owner | Vickers Jason A | $100,000 |
Source: Public Records
Tax History
| Year | Tax Paid | Tax Assessment Tax Assessment Total Assessment is a certain percentage of the fair market value that is determined by local assessors to be the total taxable value of land and additions on the property. | Land | Improvement |
|---|---|---|---|---|
| 2025 | $1,141 | $25,150 | $1,360 | $23,790 |
| 2024 | $1,141 | $22,170 | $1,360 | $20,810 |
| 2023 | $1,141 | $22,170 | $1,360 | $20,810 |
| 2022 | $1,105 | $21,530 | $1,360 | $20,170 |
| 2021 | $1,093 | $21,530 | $1,360 | $20,170 |
| 2020 | $1,046 | $19,760 | $1,360 | $18,400 |
| 2019 | $1,048 | $19,760 | $1,360 | $18,400 |
| 2018 | $1,046 | $19,760 | $0 | $0 |
| 2017 | $1,048 | $19,760 | $0 | $0 |
| 2016 | $1,058 | $20,010 | $0 | $0 |
| 2015 | $978 | $20,010 | $0 | $0 |
| 2014 | $978 | $20,010 | $0 | $0 |
Source: Public Records
Map
Nearby Homes
- 1111 S Maple St
- 1103 S Maple St
- 1017 S Maple St
- 1026 S Garrison Ave
- 1104 S Maple St
- 1028 S Garrison Ave
- 1108 S Maple St
- 1013 S Maple St
- 1123 S Maple St
- 1102 S Maple St
- 1034 S Garrison Ave
- 1116 S Maple St
- 1012 S Garrison Ave
- 1018 S Garrison Ave
- 1018 S Garrison Ave
- 1012 S Maple St
- 1122 S Maple St
- 1009 S Maple St
- 1046 S Garrison Ave
- 1046 S Garrison Ave Unit 1