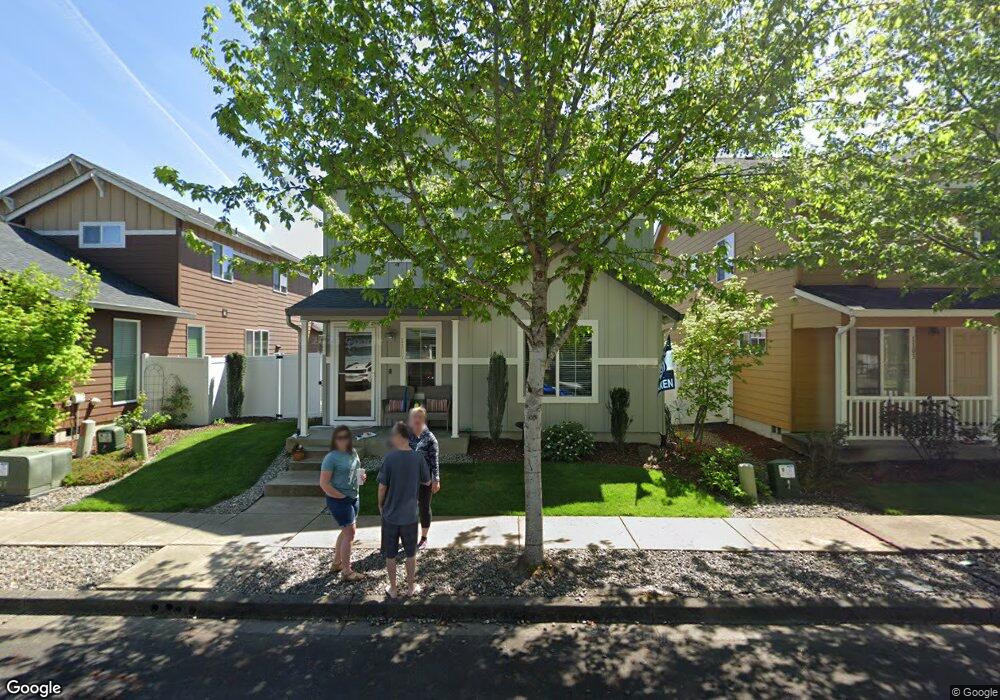
1107 SE 5th St Battle Ground, WA 98604
Estimated Value: $437,000 - $459,000
3
Beds
3
Baths
1,468
Sq Ft
$302/Sq Ft
Est. Value
About This Home
This home is located at 1107 SE 5th St, Battle Ground, WA 98604 and is currently estimated at $442,950, approximately $301 per square foot. 1107 SE 5th St is a home located in Clark County with nearby schools including Tukes Valley Primary School, Tukes Valley Middle School, and Battle Ground High School.
Ownership History
Date
Name
Owned For
Owner Type
Purchase Details
Closed on
May 15, 2014
Sold by
Colemansmith Gary
Bought by
Resser Jason and Resser Jaime
Current Estimated Value
Home Financials for this Owner
Home Financials are based on the most recent Mortgage that was taken out on this home.
Original Mortgage
$20,632
Outstanding Balance
$15,753
Interest Rate
4.38%
Mortgage Type
New Conventional
Estimated Equity
$427,197
Purchase Details
Closed on
Jan 23, 2014
Sold by
Homola John H and Mortgage Electronic Registrati
Bought by
Colemansmith Gary
Purchase Details
Closed on
Jan 6, 2010
Sold by
New Tradition Homes Inc
Bought by
Homola John H
Home Financials for this Owner
Home Financials are based on the most recent Mortgage that was taken out on this home.
Original Mortgage
$206,433
Interest Rate
4.77%
Mortgage Type
New Conventional
Create a Home Valuation Report for This Property
The Home Valuation Report is an in-depth analysis detailing your home's value as well as a comparison with similar homes in the area
Home Values in the Area
Average Home Value in this Area
Purchase History
| Date | Buyer | Sale Price | Title Company |
|---|---|---|---|
| Resser Jason | $202,500 | Cascade Title Of Clark Count | |
| Colemansmith Gary | $165,751 | 1St Am | |
| Homola John H | $202,305 | Chicago Title Insurance |
Source: Public Records
Mortgage History
| Date | Status | Borrower | Loan Amount |
|---|---|---|---|
| Open | Resser Jason | $20,632 | |
| Previous Owner | Homola John H | $206,433 |
Source: Public Records
Tax History Compared to Growth
Tax History
| Year | Tax Paid | Tax Assessment Tax Assessment Total Assessment is a certain percentage of the fair market value that is determined by local assessors to be the total taxable value of land and additions on the property. | Land | Improvement |
|---|---|---|---|---|
| 2025 | $3,103 | $392,695 | $125,000 | $267,695 |
| 2024 | $2,751 | $381,274 | $125,000 | $256,274 |
| 2023 | $2,986 | $384,552 | $125,000 | $259,552 |
| 2022 | $2,823 | $380,706 | $123,300 | $257,406 |
| 2021 | $2,748 | $312,785 | $101,250 | $211,535 |
| 2020 | $2,342 | $279,287 | $63,250 | $216,037 |
| 2019 | $1,879 | $269,785 | $71,390 | $198,395 |
| 2018 | $2,320 | $253,367 | $0 | $0 |
| 2017 | $2,031 | $229,743 | $0 | $0 |
| 2016 | $2,080 | $219,120 | $0 | $0 |
| 2015 | $2,178 | $205,924 | $0 | $0 |
| 2014 | -- | $204,618 | $0 | $0 |
| 2013 | -- | $181,562 | $0 | $0 |
Source: Public Records
Map
Nearby Homes
- 1001 30th St
- 1106 SE 6th St
- 1116 SE 6th St
- 1116 SE 33rd St
- 1124 SE 33rd St
- 1128 33rd St
- 710 SE 5th Way Unit E13
- 712 SE 5th Way Unit E12
- 3301 SE 12th Ave
- 902 SE 11th Way
- 413 SE 8th St
- 902 SE 5th Ave
- 1125 SE Clark Ave
- 2137 SW 5th Place
- 2155 SW 5th Place
- 2201 SW 5th Place
- 2207 SW 5th Place
- 213 SE 1st Ave
- 12 SE 9th Cir
- 3107 4th Ave
- 1109 SE 5th St
- 1103 SE 5th St
- 1113 SE 5th St
- 1102 SE 6th St
- 1110 SE 6th St
- 1115 SE 5th St
- 1108 SE 5th St
- 1112 SE 6th St
- 1104 SE 5th St
- 1110 SE 5th St
- 512 SE 11th Ave
- 514 SE 11th Ave
- 1114 SE 5th St
- 1100 SE 5th St
- 516 SE 11th Ave
- 508 SE 11th Ave
- 1116 SE 5th St
- 518 SE 11th Ave Unit 29
- 518 SE 11th Ave
- 1119 SE 5th St