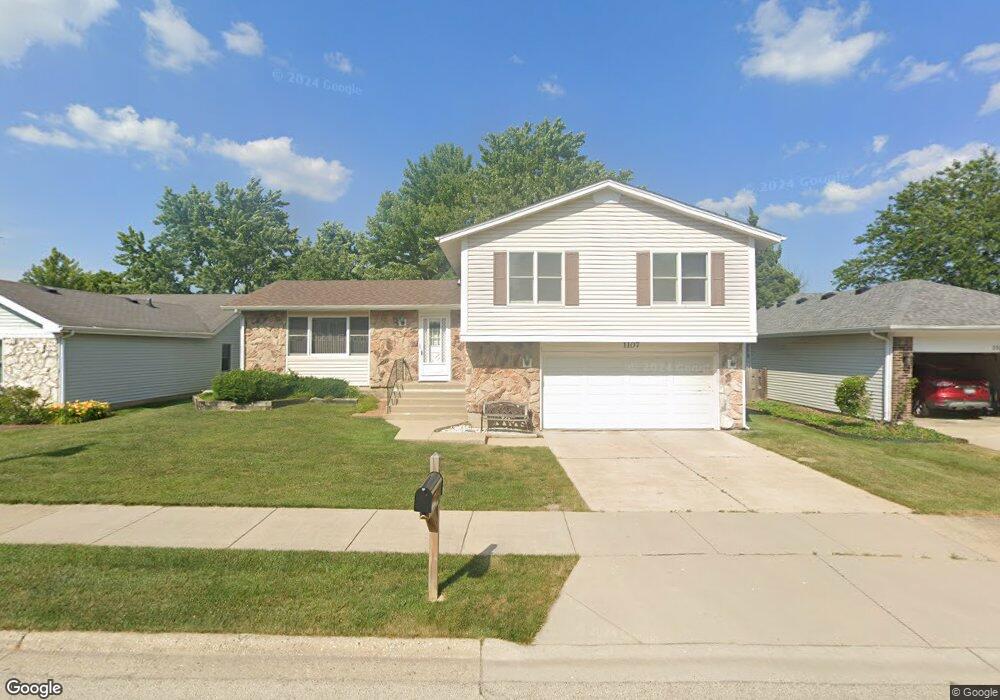
1107 Wadsworth Place Unit 11 Vernon Hills, IL 60061
Estimated Value: $451,000 - $510,000
--
Bed
2
Baths
2,004
Sq Ft
$239/Sq Ft
Est. Value
About This Home
This home is located at 1107 Wadsworth Place Unit 11, Vernon Hills, IL 60061 and is currently estimated at $477,970, approximately $238 per square foot. 1107 Wadsworth Place Unit 11 is a home located in Lake County with nearby schools including Hawthorn School Of Dual Language, Hawthorn Townline Elementary School, and Hawthorn Middle School North.
Ownership History
Date
Name
Owned For
Owner Type
Purchase Details
Closed on
Jul 2, 2025
Sold by
Sher Bret S and Sher Betsy S
Bought by
Sher Joint Trust and Sher
Current Estimated Value
Purchase Details
Closed on
Aug 21, 1998
Sold by
Lai Chi L and Lai Chi Huei
Bought by
Sher Bret S and Sher Betsy S
Home Financials for this Owner
Home Financials are based on the most recent Mortgage that was taken out on this home.
Original Mortgage
$138,700
Interest Rate
7.02%
Purchase Details
Closed on
Jun 13, 1995
Sold by
Holleb Howard A and Holleb Pamela J
Bought by
Lai Chi Liang and Lai Chi Huei
Home Financials for this Owner
Home Financials are based on the most recent Mortgage that was taken out on this home.
Original Mortgage
$152,250
Interest Rate
7.9%
Create a Home Valuation Report for This Property
The Home Valuation Report is an in-depth analysis detailing your home's value as well as a comparison with similar homes in the area
Home Values in the Area
Average Home Value in this Area
Purchase History
| Date | Buyer | Sale Price | Title Company |
|---|---|---|---|
| Sher Joint Trust | -- | None Listed On Document | |
| Sher Bret S | $221,000 | -- | |
| Lai Chi Liang | $203,000 | -- |
Source: Public Records
Mortgage History
| Date | Status | Borrower | Loan Amount |
|---|---|---|---|
| Previous Owner | Sher Bret S | $138,700 | |
| Previous Owner | Lai Chi Liang | $152,250 |
Source: Public Records
Tax History Compared to Growth
Tax History
| Year | Tax Paid | Tax Assessment Tax Assessment Total Assessment is a certain percentage of the fair market value that is determined by local assessors to be the total taxable value of land and additions on the property. | Land | Improvement |
|---|---|---|---|---|
| 2024 | $10,184 | $130,650 | $46,983 | $83,667 |
| 2023 | $10,071 | $116,993 | $42,072 | $74,921 |
| 2022 | $10,071 | $113,889 | $40,438 | $73,451 |
| 2021 | $9,636 | $111,438 | $39,568 | $71,870 |
| 2020 | $9,286 | $109,565 | $38,903 | $70,662 |
| 2019 | $9,052 | $108,523 | $38,533 | $69,990 |
| 2018 | $8,621 | $105,400 | $38,286 | $67,114 |
| 2017 | $8,487 | $102,072 | $37,077 | $64,995 |
| 2016 | $8,135 | $96,778 | $35,154 | $61,624 |
| 2015 | $8,006 | $90,455 | $32,857 | $57,598 |
| 2014 | $7,274 | $81,982 | $29,469 | $52,513 |
| 2012 | $8,085 | $82,694 | $29,725 | $52,969 |
Source: Public Records
Map
Nearby Homes
- 1109 Grant Place
- 1028 Cumberland Ct
- 11 Echo Ct Unit 12
- 20 Echo Ct Unit 3
- 15 Crestview Ln Unit 4
- 365 Jefferson Ct Unit 65
- 4 Parkside Ct Unit 12
- 608 Sycamore St
- 464 Buchanan Ct
- 1434 Maidstone Dr
- 139 Windsor Dr Unit 123
- 900 S Butterfield Rd
- 1654 Pebble Beach Way
- 1290 Butterfield Rd
- 215 Coventry Cir Unit 215
- 240 Southwick Ct Unit 52
- 1688 Saint Andrew Dr
- 717 Summit Ln
- 1620 Nicklaus Ct
- 410 Bay Tree Cir
- 1105 Wadsworth Place
- 1109 Wadsworth Place
- 1106 Whitman Place
- 1104 Whitman Place
- 1108 Whitman Place Unit 11
- 1103 Wadsworth Place Unit 11
- 1106 Wadsworth Place
- 1104 Wadsworth Place
- 1108 Wadsworth Place
- 1102 Whitman Place
- 1101 Wadsworth Place
- 1102 Wadsworth Place
- 206 Lowell Place
- 204 Lowell Place Unit 11
- 1110 Wadsworth Place
- 1100 Whitman Place
- 208 Lowell Place
- 202 Lowell Place
- 1100 Wadsworth Place
- 1107 Whitman Place