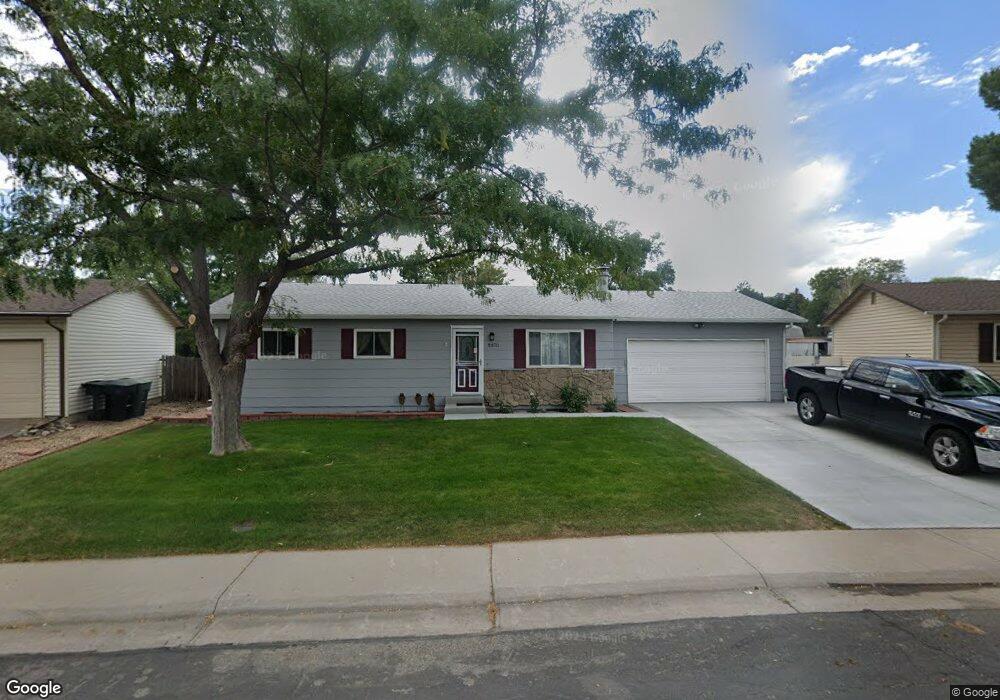
11070 Clermont Dr Thornton, CO 80233
Grange Creek NeighborhoodEstimated Value: $440,492 - $494,000
3
Beds
1
Bath
1,040
Sq Ft
$445/Sq Ft
Est. Value
About This Home
This home is located at 11070 Clermont Dr, Thornton, CO 80233 and is currently estimated at $462,623, approximately $444 per square foot. 11070 Clermont Dr is a home located in Adams County with nearby schools including Riverdale Elementary School, Shadow Ridge Middle School, and Thornton High School.
Ownership History
Date
Name
Owned For
Owner Type
Purchase Details
Closed on
Sep 8, 2003
Sold by
Kent Christine K
Bought by
Detemple Christine K
Current Estimated Value
Home Financials for this Owner
Home Financials are based on the most recent Mortgage that was taken out on this home.
Original Mortgage
$180,900
Interest Rate
6.22%
Mortgage Type
Balloon
Purchase Details
Closed on
Aug 6, 2003
Sold by
Kent Patrick L
Bought by
Kent Christine K
Home Financials for this Owner
Home Financials are based on the most recent Mortgage that was taken out on this home.
Original Mortgage
$180,900
Interest Rate
6.22%
Mortgage Type
Balloon
Purchase Details
Closed on
Apr 21, 2003
Sold by
Kent Patrick L and Kent Christine K
Bought by
Kent Patrick L
Home Financials for this Owner
Home Financials are based on the most recent Mortgage that was taken out on this home.
Original Mortgage
$165,600
Interest Rate
5.57%
Mortgage Type
Balloon
Create a Home Valuation Report for This Property
The Home Valuation Report is an in-depth analysis detailing your home's value as well as a comparison with similar homes in the area
Home Values in the Area
Average Home Value in this Area
Purchase History
| Date | Buyer | Sale Price | Title Company |
|---|---|---|---|
| Detemple Christine K | -- | First American Heritage Titl | |
| Kent Christine K | -- | First American Heritage Titl | |
| Kent Patrick L | -- | -- |
Source: Public Records
Mortgage History
| Date | Status | Borrower | Loan Amount |
|---|---|---|---|
| Closed | Detemple Christine K | $180,900 | |
| Previous Owner | Kent Patrick L | $165,600 |
Source: Public Records
Tax History Compared to Growth
Tax History
| Year | Tax Paid | Tax Assessment Tax Assessment Total Assessment is a certain percentage of the fair market value that is determined by local assessors to be the total taxable value of land and additions on the property. | Land | Improvement |
|---|---|---|---|---|
| 2024 | $2,703 | $26,440 | $5,940 | $20,500 |
| 2023 | $2,675 | $29,840 | $6,090 | $23,750 |
| 2022 | $2,581 | $23,430 | $5,700 | $17,730 |
| 2021 | $2,667 | $23,430 | $5,700 | $17,730 |
| 2020 | $2,553 | $22,880 | $5,860 | $17,020 |
| 2019 | $2,558 | $22,880 | $5,860 | $17,020 |
| 2018 | $2,075 | $18,030 | $5,760 | $12,270 |
| 2017 | $1,886 | $18,030 | $5,760 | $12,270 |
| 2016 | $1,434 | $13,340 | $3,260 | $10,080 |
| 2015 | $1,432 | $13,340 | $3,260 | $10,080 |
| 2014 | $1,266 | $11,470 | $2,550 | $8,920 |
Source: Public Records
Map
Nearby Homes
- 11135 Clermont Dr
- 4520 E 112th Place
- 4807 E 110th Place
- 4911 E 112th Place
- 4346 E 113th Place
- 11068 Eudora Cir
- 5056 E 112th Ct
- 5055 E 112th Ct
- 10895 Fairfax Way
- 11062 Fairfax Cir
- 10985 Glencoe Place
- 4310 E 107th Ct
- 10979 Grange Creek Dr
- 11343 Grape Cir
- 11279 Holly St
- 11293 Holly St
- 4205 E 106th Place
- 5452 E 108th Place
- 10752 Madison St
- 11546 Monroe Way
- 11072 Clermont Dr
- 11062 Clermont Dr
- 11060 Clermont Dr
- 11080 Clermont Way
- 11082 Clermont Way
- 11071 Clermont Dr
- 11061 Clermont Dr
- 11025 Bellaire Cir
- 11015 Bellaire Cir
- 11090 Clermont Way
- 11051 Clermont Dr
- 11052 Clermont Dr
- 11081 Clermont Dr
- 11035 Bellaire Cir
- 11182 Albion Way
- 11074 Clermont Dr
- 11091 Clermont Dr
- 11084 Clermont Dr
- 11041 Clermont Dr
- 11050 Clermont Dr