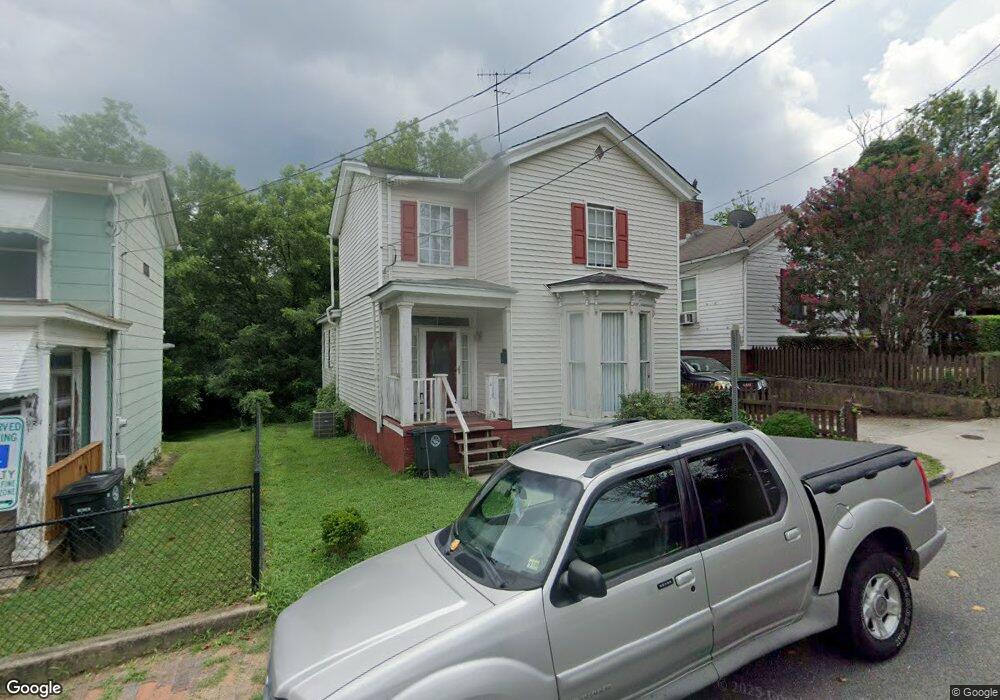
1108 10th St Lynchburg, VA 24504
College Hill NeighborhoodEstimated Value: $111,000 - $134,000
2
Beds
2
Baths
1,739
Sq Ft
$73/Sq Ft
Est. Value
About This Home
This home is located at 1108 10th St, Lynchburg, VA 24504 and is currently estimated at $126,732, approximately $72 per square foot. 1108 10th St is a home located in Lynchburg City with nearby schools including Perrymont Elementary School, Paul Laurence Dunbar Mid. for Innov., and Heritage High School.
Ownership History
Date
Name
Owned For
Owner Type
Purchase Details
Closed on
May 31, 2022
Sold by
Camm James E
Bought by
Camm James E
Current Estimated Value
Purchase Details
Closed on
Nov 10, 2010
Sold by
Younger Edna
Bought by
Camm James E
Purchase Details
Closed on
Jun 12, 2008
Sold by
Camm James E
Bought by
Younger Edna
Purchase Details
Closed on
Jun 27, 2006
Sold by
Su Judy Chiou
Bought by
Camm James E
Purchase Details
Closed on
Aug 10, 2005
Sold by
Sandifer Robert M and Cobbs Calvin O
Bought by
Su Judy Chiou
Purchase Details
Closed on
Dec 29, 2004
Sold by
Sandifer Robert M
Bought by
Cobbs Calvin O
Create a Home Valuation Report for This Property
The Home Valuation Report is an in-depth analysis detailing your home's value as well as a comparison with similar homes in the area
Home Values in the Area
Average Home Value in this Area
Purchase History
| Date | Buyer | Sale Price | Title Company |
|---|---|---|---|
| Camm James E | -- | None Listed On Document | |
| Camm James E | -- | None Available | |
| Younger Edna | -- | None Available | |
| Camm James E | -- | None Available | |
| Su Judy Chiou | $5,050 | None Available | |
| Cobbs Calvin O | -- | None Available |
Source: Public Records
Tax History Compared to Growth
Tax History
| Year | Tax Paid | Tax Assessment Tax Assessment Total Assessment is a certain percentage of the fair market value that is determined by local assessors to be the total taxable value of land and additions on the property. | Land | Improvement |
|---|---|---|---|---|
| 2025 | $980 | $116,700 | $16,500 | $100,200 |
| 2024 | $700 | $78,700 | $15,400 | $63,300 |
| 2023 | $700 | $78,700 | $15,400 | $63,300 |
| 2022 | $691 | $67,100 | $11,000 | $56,100 |
| 2021 | $559 | $67,100 | $11,000 | $56,100 |
| 2020 | $717 | $64,600 | $8,000 | $56,600 |
| 2019 | $717 | $64,600 | $8,000 | $56,600 |
| 2018 | $705 | $63,500 | $8,000 | $55,500 |
| 2017 | $705 | $63,500 | $8,000 | $55,500 |
| 2016 | $705 | $63,500 | $8,000 | $55,500 |
| 2015 | $705 | $42,200 | $1,500 | $40,700 |
| 2014 | $234 | $42,200 | $1,500 | $40,700 |
Source: Public Records
Map
Nearby Homes