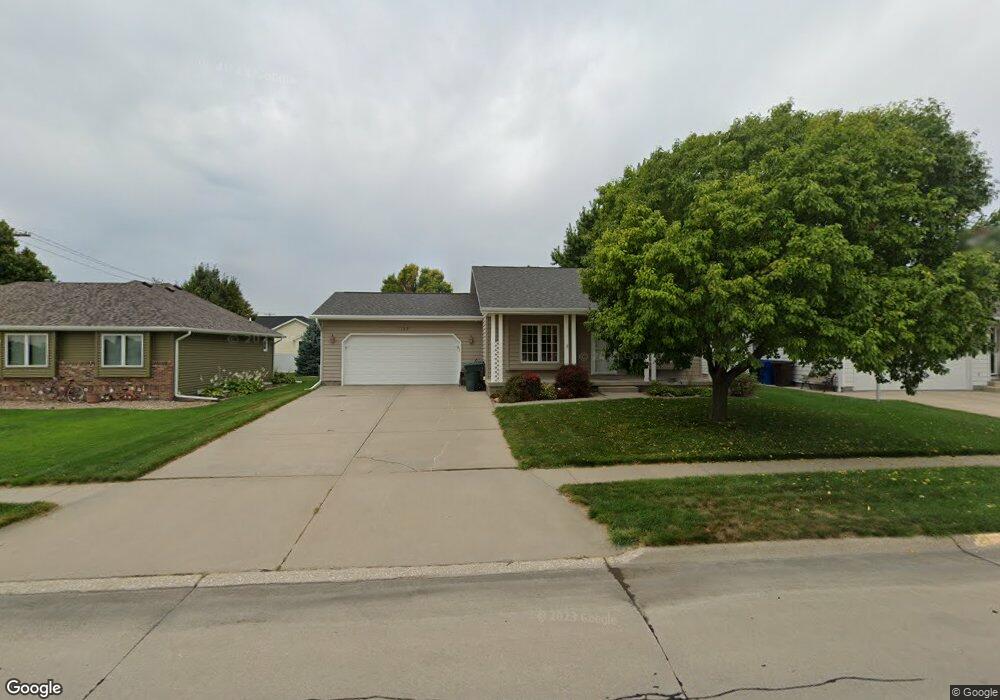
1108 16th Ave Kearney, NE 68845
Estimated Value: $310,533 - $366,000
3
Beds
3
Baths
1,288
Sq Ft
$262/Sq Ft
Est. Value
About This Home
This home is located at 1108 16th Ave, Kearney, NE 68845 and is currently estimated at $337,633, approximately $262 per square foot. 1108 16th Ave is a home located in Buffalo County with nearby schools including Kenwood Elementary School, Horizon Middle School, and Kearney Senior High School.
Ownership History
Date
Name
Owned For
Owner Type
Purchase Details
Closed on
Feb 10, 2012
Sold by
Ochsner Michael C
Bought by
Dahlin Nathan S
Current Estimated Value
Home Financials for this Owner
Home Financials are based on the most recent Mortgage that was taken out on this home.
Original Mortgage
$136,000
Outstanding Balance
$93,664
Interest Rate
4%
Estimated Equity
$243,969
Purchase Details
Closed on
Sep 27, 2007
Sold by
Runge Darby R and Runge Traci L
Bought by
Ochsner Michael C
Create a Home Valuation Report for This Property
The Home Valuation Report is an in-depth analysis detailing your home's value as well as a comparison with similar homes in the area
Home Values in the Area
Average Home Value in this Area
Purchase History
| Date | Buyer | Sale Price | Title Company |
|---|---|---|---|
| Dahlin Nathan S | -- | Barney | |
| Ochsner Michael C | $169,900 | Barney |
Source: Public Records
Mortgage History
| Date | Status | Borrower | Loan Amount |
|---|---|---|---|
| Open | Dahlin Nathan S | $136,000 |
Source: Public Records
Tax History Compared to Growth
Tax History
| Year | Tax Paid | Tax Assessment Tax Assessment Total Assessment is a certain percentage of the fair market value that is determined by local assessors to be the total taxable value of land and additions on the property. | Land | Improvement |
|---|---|---|---|---|
| 2025 | $3,608 | $283,910 | $34,215 | $249,695 |
| 2024 | $3,608 | $270,655 | $33,220 | $237,435 |
| 2023 | $4,185 | $245,905 | $33,220 | $212,685 |
| 2022 | $3,710 | $211,390 | $31,165 | $180,225 |
| 2021 | $3,518 | $203,975 | $32,515 | $171,460 |
| 2020 | $3,519 | $203,425 | $32,515 | $170,910 |
| 2019 | $3,397 | $194,010 | $32,515 | $161,495 |
| 2018 | $3,388 | $196,300 | $32,515 | $163,785 |
| 2017 | $3,199 | $186,545 | $32,515 | $154,030 |
| 2016 | $3,251 | $191,195 | $32,515 | $158,680 |
| 2015 | $3,071 | $176,560 | $0 | $0 |
| 2014 | $2,942 | $154,315 | $0 | $0 |
Source: Public Records
Map
Nearby Homes