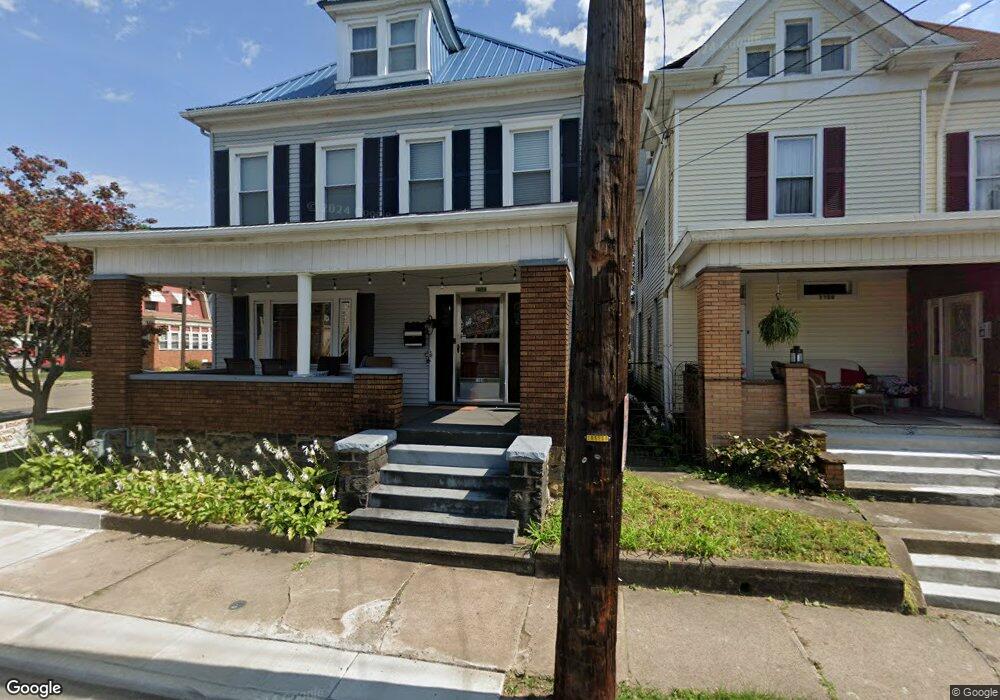
1108 5th St New Brighton, PA 15066
Estimated Value: $128,000 - $192,000
5
Beds
1
Bath
2,349
Sq Ft
$70/Sq Ft
Est. Value
About This Home
This home is located at 1108 5th St, New Brighton, PA 15066 and is currently estimated at $165,333, approximately $70 per square foot. 1108 5th St is a home located in Beaver County with nearby schools including New Brighton Elementary School, New Brighton Area Middle School, and New Brighton Area High School.
Ownership History
Date
Name
Owned For
Owner Type
Purchase Details
Closed on
Sep 4, 2013
Sold by
Hardesty Chrislyn
Bought by
Mowry John Neal and Young Mowry Chrislyn M
Current Estimated Value
Home Financials for this Owner
Home Financials are based on the most recent Mortgage that was taken out on this home.
Original Mortgage
$99,750
Outstanding Balance
$74,260
Interest Rate
4.34%
Mortgage Type
New Conventional
Estimated Equity
$91,073
Purchase Details
Closed on
Jul 13, 2007
Sold by
Hardesty David
Bought by
Hardesty David B
Home Financials for this Owner
Home Financials are based on the most recent Mortgage that was taken out on this home.
Original Mortgage
$106,250
Interest Rate
6.73%
Mortgage Type
New Conventional
Purchase Details
Closed on
Feb 25, 2004
Sold by
Pavlinich Randy A
Bought by
Hardesty David E
Home Financials for this Owner
Home Financials are based on the most recent Mortgage that was taken out on this home.
Original Mortgage
$91,200
Interest Rate
5.65%
Mortgage Type
New Conventional
Create a Home Valuation Report for This Property
The Home Valuation Report is an in-depth analysis detailing your home's value as well as a comparison with similar homes in the area
Home Values in the Area
Average Home Value in this Area
Purchase History
| Date | Buyer | Sale Price | Title Company |
|---|---|---|---|
| Mowry John Neal | $126,000 | None Available | |
| Hardesty David B | $125,000 | -- | |
| Hardesty David E | $96,000 | -- |
Source: Public Records
Mortgage History
| Date | Status | Borrower | Loan Amount |
|---|---|---|---|
| Open | Mowry John Neal | $99,750 | |
| Previous Owner | Hardesty David B | $106,250 | |
| Previous Owner | Hardesty David E | $91,200 |
Source: Public Records
Tax History Compared to Growth
Tax History
| Year | Tax Paid | Tax Assessment Tax Assessment Total Assessment is a certain percentage of the fair market value that is determined by local assessors to be the total taxable value of land and additions on the property. | Land | Improvement |
|---|---|---|---|---|
| 2025 | $1,007 | $62,700 | $11,200 | $51,500 |
| 2024 | $2,562 | $62,700 | $11,200 | $51,500 |
| 2023 | $3,384 | $26,650 | $3,000 | $23,650 |
| 2022 | $3,344 | $26,650 | $3,000 | $23,650 |
| 2021 | $3,344 | $26,650 | $3,000 | $23,650 |
| 2020 | $3,254 | $26,650 | $3,000 | $23,650 |
| 2019 | $3,201 | $26,650 | $3,000 | $23,650 |
| 2018 | $3,077 | $26,650 | $3,000 | $23,650 |
| 2017 | $3,077 | $26,650 | $3,000 | $23,650 |
| 2016 | $2,918 | $26,650 | $3,000 | $23,650 |
| 2015 | $592 | $26,650 | $3,000 | $23,650 |
| 2014 | $592 | $26,650 | $3,000 | $23,650 |
Source: Public Records
Map
Nearby Homes