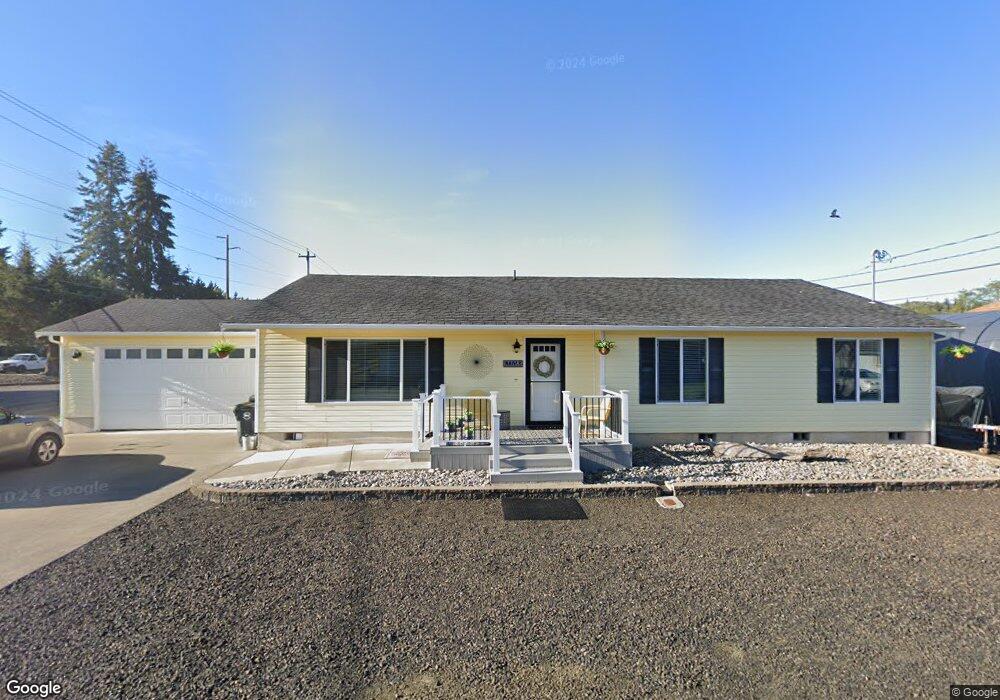
1108 Berkley St Hoquiam, WA 98550
Estimated Value: $312,000 - $384,022
3
Beds
2
Baths
1,716
Sq Ft
$202/Sq Ft
Est. Value
About This Home
This home is located at 1108 Berkley St, Hoquiam, WA 98550 and is currently estimated at $347,341, approximately $202 per square foot. 1108 Berkley St is a home located in Grays Harbor County with nearby schools including Lincoln Elementary School, Emerson Elementary School, and Central Elementary School.
Ownership History
Date
Name
Owned For
Owner Type
Purchase Details
Closed on
Apr 26, 2018
Sold by
Durman Stanley E
Bought by
Reynolds Cynthia B and Reynolds Mark A
Current Estimated Value
Purchase Details
Closed on
Apr 25, 2018
Sold by
Durman Stanley E
Bought by
Reynolds Cynthia B and Reynolds Mark A
Purchase Details
Closed on
Oct 1, 2014
Sold by
Reynolds Cynthia B
Bought by
Durman Stanley E
Purchase Details
Closed on
Apr 24, 2012
Sold by
Durman Stanley E
Bought by
Reynolds Cynthia B
Purchase Details
Closed on
Jun 30, 2010
Sold by
Durman Stanley E
Bought by
Durman Stanley E and Reynolds Cynthia B
Purchase Details
Closed on
Sep 8, 2006
Sold by
Sibbett James L and Sibbett Mary Anna N
Bought by
Durman Stanley and Durman Dorothy
Purchase Details
Closed on
Dec 19, 2005
Sold by
Strabbing Ronald A
Bought by
Sibbett James L and Sibbett Mary Anna N
Create a Home Valuation Report for This Property
The Home Valuation Report is an in-depth analysis detailing your home's value as well as a comparison with similar homes in the area
Home Values in the Area
Average Home Value in this Area
Purchase History
| Date | Buyer | Sale Price | Title Company |
|---|---|---|---|
| Reynolds Cynthia B | -- | None Available | |
| Reynolds Cynthia B | -- | None Listed On Document | |
| Durman Stanley E | -- | None Available | |
| Reynolds Cynthia B | -- | None Available | |
| Durman Stanley E | -- | Grays Harbor Title Company | |
| Durman Stanley | $20,000 | Grays Harbor Title | |
| Sibbett James L | -- | None Available |
Source: Public Records
Tax History Compared to Growth
Tax History
| Year | Tax Paid | Tax Assessment Tax Assessment Total Assessment is a certain percentage of the fair market value that is determined by local assessors to be the total taxable value of land and additions on the property. | Land | Improvement |
|---|---|---|---|---|
| 2025 | $3,701 | $392,761 | $21,420 | $371,341 |
| 2023 | $4,138 | $297,308 | $25,200 | $272,108 |
| 2022 | $3,649 | $287,094 | $14,000 | $273,094 |
| 2021 | $3,145 | $287,094 | $14,000 | $273,094 |
| 2020 | $2,738 | $232,475 | $14,000 | $218,475 |
| 2019 | $2,209 | $196,063 | $14,000 | $182,063 |
| 2018 | $2,152 | $165,719 | $14,000 | $151,719 |
| 2017 | $2,051 | $135,375 | $14,000 | $121,375 |
| 2016 | $2,361 | $135,375 | $14,000 | $121,375 |
| 2014 | -- | $156,840 | $14,000 | $142,840 |
| 2013 | -- | $150,655 | $14,000 | $136,655 |
Source: Public Records
Map
Nearby Homes
- 2025 Panama Ave
- 1900 Broadway Ave Unit 59
- 1900 Broadway Ave Unit 2
- 1111 Division St
- 2010 Broadway Ave Unit 38
- 2010 Broadway Ave Unit 9
- 2010 Broadway Ave Unit 41
- 1010 Division St
- 2220 Panama Ave
- 0 NKA Highway 101
- 0 Off of Panhandle Rd
- 11111 Panhandle Rd
- 909 Wood Ave
- 1213 Lincoln St
- 1309 Marion St
- 3108 Sanderling Dr
- 0 Cosgrove St Unit NWM2403284
- 1020 Rayonier Ave
- 3261 Sanderling Dr
- 723 Broadway Ave
- 1940 Panama Ave
- 1109 Berkley St
- 2002 Panama Ave
- 1925 Broadway Ave
- 1930 Panama Ave
- 2017 Broadway Ave
- 2011 Broadway Ave
- 2000 Broadway Ave Unit 18
- 2000 Broadway Ave
- 2000 Broadway Ave Unit 15
- 2000 Broadway Ave Unit 19
- 2000 Broadway Ave Unit 64
- 2000 Broadway Ave Unit 11
- 2000 Broadway Ave Unit 61
- 2000 Broadway Ave Unit 59
- 2008 Panama Ave
- 1914 Panama Ave
- 1915 Broadway Ave
- 1933 Panama Ave
- 2015 Panama Ave