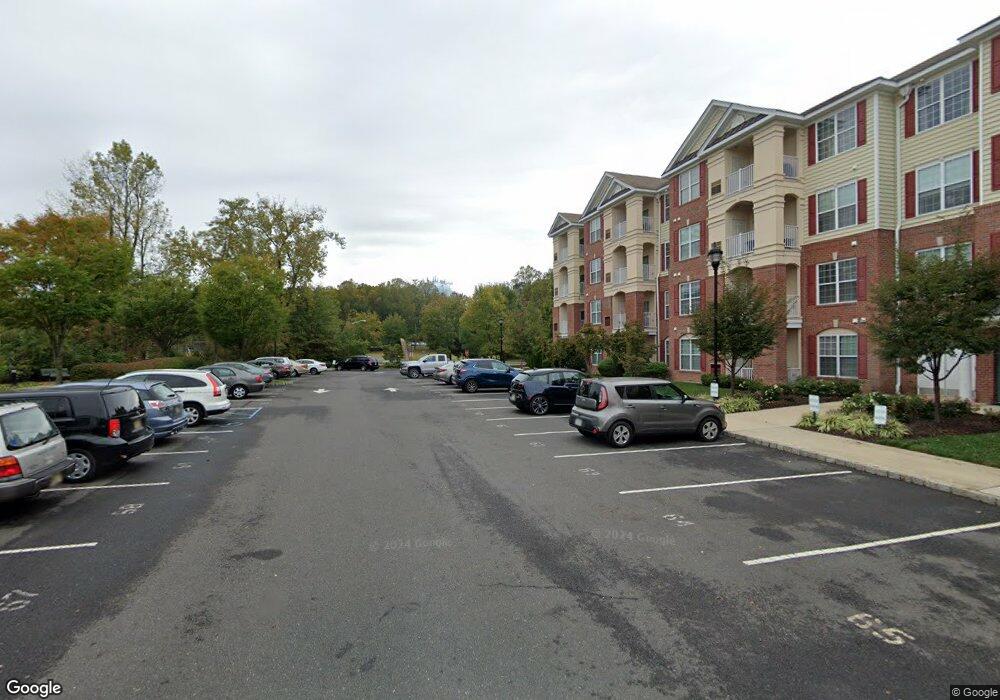
1108 Colts Cir Unit C Lawrence Township, NJ 08648
Estimated Value: $211,821 - $227,000
--
Bed
1
Bath
867
Sq Ft
$257/Sq Ft
Est. Value
About This Home
This home is located at 1108 Colts Cir Unit C, Lawrence Township, NJ 08648 and is currently estimated at $222,705, approximately $256 per square foot. 1108 Colts Cir Unit C is a home located in Mercer County with nearby schools including Lawrence High School, Paul Robeson Charter School For The Humanities, and Notre Dame High School.
Ownership History
Date
Name
Owned For
Owner Type
Purchase Details
Closed on
May 5, 2022
Sold by
Karen Romanowsky
Bought by
Khurana Prakash
Current Estimated Value
Purchase Details
Closed on
May 27, 2020
Sold by
Romanowsky Karen and Romanowsky Frederick
Bought by
Romanowsky Karen
Purchase Details
Closed on
Mar 11, 2010
Sold by
Kalian M A M and Kalian Lawrence Kalian
Bought by
Romanowsky Karen and Romanowsky Frederick
Home Financials for this Owner
Home Financials are based on the most recent Mortgage that was taken out on this home.
Interest Rate
4.95%
Purchase Details
Closed on
Dec 18, 2009
Sold by
Kalian At Lawrence Llc
Bought by
Romanowsky Karen and Romanowsky Frederick
Home Financials for this Owner
Home Financials are based on the most recent Mortgage that was taken out on this home.
Original Mortgage
$134,910
Interest Rate
5%
Mortgage Type
New Conventional
Create a Home Valuation Report for This Property
The Home Valuation Report is an in-depth analysis detailing your home's value as well as a comparison with similar homes in the area
Home Values in the Area
Average Home Value in this Area
Purchase History
| Date | Buyer | Sale Price | Title Company |
|---|---|---|---|
| Khurana Prakash | $160,000 | None Listed On Document | |
| Romanowsky Karen | -- | First American Title | |
| Romanowsky Karen | -- | -- | |
| Romanowsky Karen | $149,900 | Empire Title & Abstract Agen |
Source: Public Records
Mortgage History
| Date | Status | Borrower | Loan Amount |
|---|---|---|---|
| Previous Owner | Romanowsky Karen | -- | |
| Previous Owner | Romanowsky Karen | $134,910 |
Source: Public Records
Tax History Compared to Growth
Tax History
| Year | Tax Paid | Tax Assessment Tax Assessment Total Assessment is a certain percentage of the fair market value that is determined by local assessors to be the total taxable value of land and additions on the property. | Land | Improvement |
|---|---|---|---|---|
| 2025 | $3,811 | $123,000 | $40,000 | $83,000 |
| 2024 | $3,734 | $123,000 | $40,000 | $83,000 |
| 2023 | $3,734 | $123,000 | $40,000 | $83,000 |
| 2022 | $3,667 | $123,000 | $40,000 | $83,000 |
| 2021 | $3,620 | $123,000 | $40,000 | $83,000 |
| 2020 | $3,569 | $123,000 | $40,000 | $83,000 |
| 2019 | $3,524 | $123,000 | $40,000 | $83,000 |
| 2018 | $3,444 | $123,000 | $40,000 | $83,000 |
| 2017 | $3,428 | $123,000 | $40,000 | $83,000 |
| 2016 | $3,378 | $123,000 | $40,000 | $83,000 |
| 2015 | $3,284 | $123,000 | $40,000 | $83,000 |
| 2014 | $3,223 | $123,000 | $40,000 | $83,000 |
Source: Public Records
Map
Nearby Homes
- 1409 Colts Cir Unit D
- 1221 Colts Cir Unit Q
- 1309 Colts Cir Unit D
- 1424 Colts Cir Unit 1424
- 317 Glenn Ave
- 3 Camelia Ct
- 52 Stonicker Dr
- 6 Hillsdale Rd
- 9 Barnett Rd
- 62 Glenn Ave
- 54 Rutgers Ave
- 155 Franklin Corner Rd
- 66 Rutgers Ave
- 24 Vetterlein Ave
- 115 Hughes Ave
- 125 Laura Ave
- 81 Berwyn Place
- 0 Locust Ave
- 44 Sandalwood Ave
- 36 Birdie Way
- 1108 Colts Cir Unit 1108
- 1308 Colts Cir Unit 1308
- 1308 Colts Cir Unit F1
- 1208 Colts Cir
- 1118 Colts Cir
- 1118 Colts Cir Unit F
- 1408 Colts Cir Unit F1
- 1408 Colts Cir
- 1201 Colts Cir Unit E
- 1201 Colts Cir Unit 1201
- 1206 Colts Cir
- 1407 Colts Cir Unit 1407
- 1407 Colts Cir Unit F3
- 1209 Colts Cir Unit D
- 1209 Colts Cir Unit 1209
- 1119 Colts Cir
- 1406 Colts Cir
- 1211 Colts Cir
- 1307 Colts Cir
- 1409 Colts Cir Unit 1409