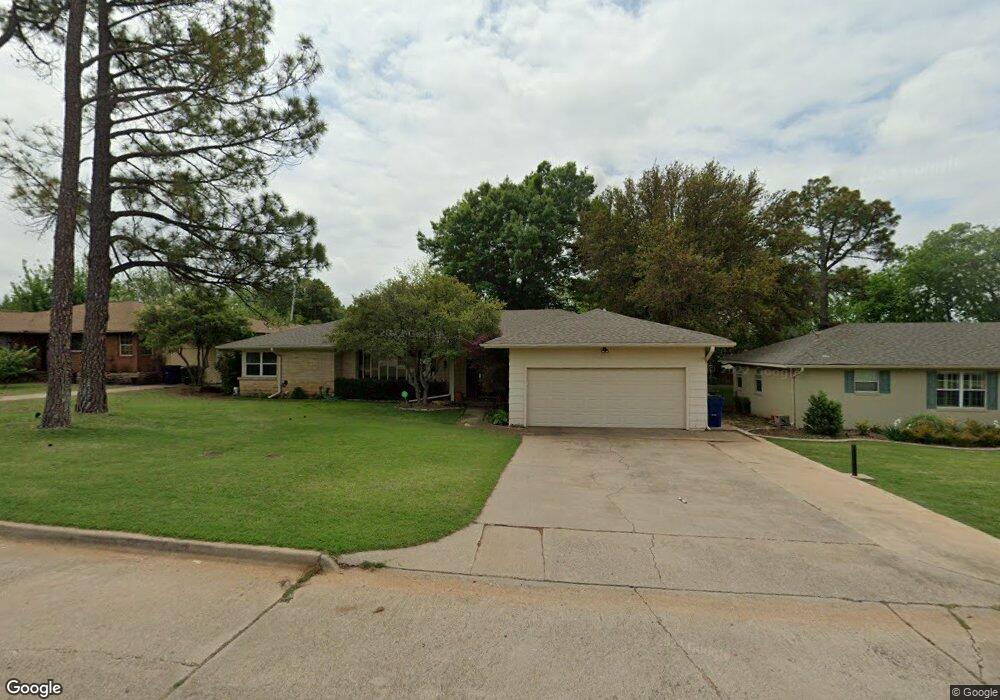
1108 Crescent Dr Duncan, OK 73533
Estimated Value: $244,307 - $315,000
3
Beds
2
Baths
2,299
Sq Ft
$120/Sq Ft
Est. Value
About This Home
This home is located at 1108 Crescent Dr, Duncan, OK 73533 and is currently estimated at $275,577, approximately $119 per square foot. 1108 Crescent Dr is a home located in Stephens County with nearby schools including Plato Elementary School, Duncan Middle School, and Duncan High School.
Ownership History
Date
Name
Owned For
Owner Type
Purchase Details
Closed on
Jul 21, 2016
Sold by
Holtmyer Jeffrey L and Holtmyer Stacy C
Bought by
Garland Benjamin W and Garland Teresa J
Current Estimated Value
Home Financials for this Owner
Home Financials are based on the most recent Mortgage that was taken out on this home.
Original Mortgage
$151,960
Outstanding Balance
$121,061
Interest Rate
3.6%
Mortgage Type
Future Advance Clause Open End Mortgage
Estimated Equity
$154,516
Purchase Details
Closed on
Apr 21, 2006
Sold by
Cross Robert M and Cross Judith L
Bought by
Holtmyer Jeffrey L and Holtmyer Stacy C
Home Financials for this Owner
Home Financials are based on the most recent Mortgage that was taken out on this home.
Original Mortgage
$143,100
Interest Rate
6.32%
Mortgage Type
New Conventional
Create a Home Valuation Report for This Property
The Home Valuation Report is an in-depth analysis detailing your home's value as well as a comparison with similar homes in the area
Home Values in the Area
Average Home Value in this Area
Purchase History
| Date | Buyer | Sale Price | Title Company |
|---|---|---|---|
| Garland Benjamin W | $190,000 | None Available | |
| Holtmyer Jeffrey L | $170,000 | None Available |
Source: Public Records
Mortgage History
| Date | Status | Borrower | Loan Amount |
|---|---|---|---|
| Open | Garland Benjamin W | $151,960 | |
| Previous Owner | Holtmyer Jeffrey L | $143,100 |
Source: Public Records
Tax History Compared to Growth
Tax History
| Year | Tax Paid | Tax Assessment Tax Assessment Total Assessment is a certain percentage of the fair market value that is determined by local assessors to be the total taxable value of land and additions on the property. | Land | Improvement |
|---|---|---|---|---|
| 2025 | $1,736 | $21,579 | $1,606 | $19,973 |
| 2024 | $1,813 | $22,288 | $1,606 | $20,682 |
| 2023 | $1,813 | $21,925 | $1,606 | $20,319 |
| 2022 | $1,701 | $21,009 | $1,606 | $19,403 |
| 2021 | $1,752 | $21,571 | $1,606 | $19,965 |
| 2020 | $1,743 | $21,189 | $1,606 | $19,583 |
| 2019 | $1,693 | $20,572 | $1,606 | $18,966 |
| 2018 | $1,784 | $21,031 | $1,606 | $19,425 |
| 2017 | $1,723 | $21,044 | $1,606 | $19,438 |
| 2016 | $1,345 | $16,829 | $1,606 | $15,223 |
| 2015 | $1,384 | $16,829 | $1,606 | $15,223 |
| 2014 | $1,384 | $16,626 | $1,522 | $15,104 |
Source: Public Records
Map
Nearby Homes
- 1107 W Elk Ave
- 1412 N 12th St
- 1508 N 13th St
- 807 Columbus Place
- 1527 1527 N 13th
- 1402 1402 W Elk Ave
- 1405 Evergreen Dr
- 1404 1404 Ne Aspen
- 1312 Pkwy
- 1601 1601 Pearl
- 1202 N Grand Blvd
- 1444 N 8th St
- 1112 1112 N 12th
- 1114 N 13th St
- 1105 N Grand Blvd
- 1001 1001 W Hackberry
- 1800 N 5th St
- 2110 W Club Rd
- 2106 Carolin Dr
- 0 Townsend St
- 1104 Crescent Dr
- 1110 Crescent Dr
- 1102 Crescent Dr
- 1112 Crescent Dr
- 1105 W Elk Ave
- 1109 W Elk Ave
- 1107 Crescent Dr
- 1105 Crescent Dr
- 1501 Crescent Dr
- 1551 Crescent Dr
- 1109 Crescent Dr
- 1103 Crescent Dr
- 1115 Crescent Dr
- 1111 Crescent Dr
- 1113 Crescent Dr
- 1506 Crescent Dr
- 1508 Crescent Dr
- 1504 Crescent Dr
- 1101 Crescent Dr
- 1102 W Elk Ave