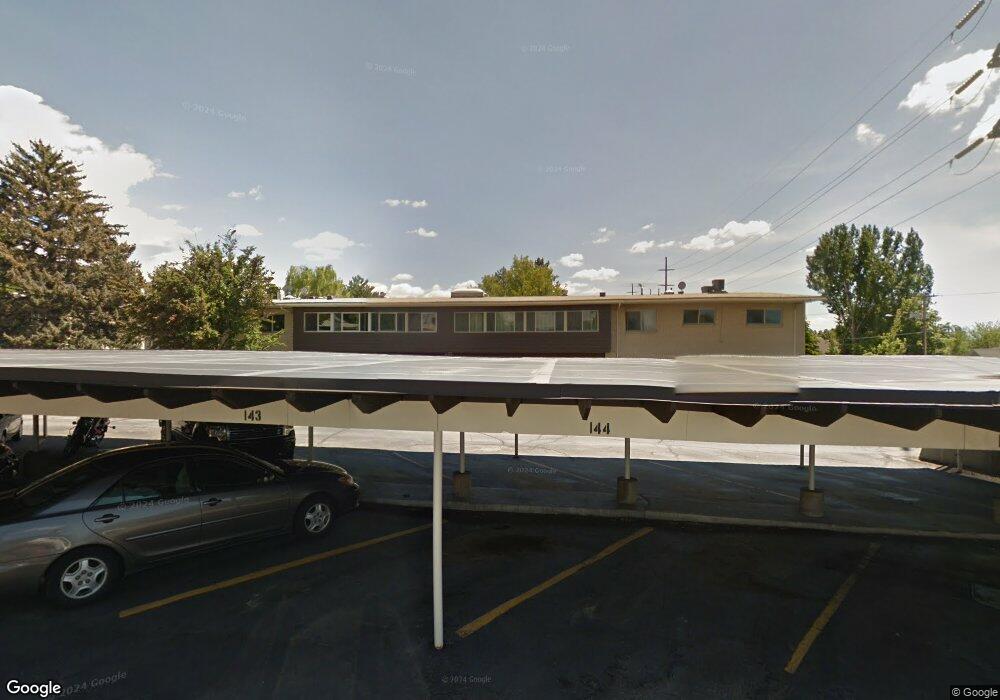
1108 E 2700 S Unit B9 Salt Lake City, UT 84106
Sugar House NeighborhoodEstimated Value: $355,000 - $395,000
2
Beds
1
Bath
1,500
Sq Ft
$251/Sq Ft
Est. Value
About This Home
This home is located at 1108 E 2700 S Unit B9, Salt Lake City, UT 84106 and is currently estimated at $376,713, approximately $251 per square foot. 1108 E 2700 S Unit B9 is a home located in Salt Lake County with nearby schools including Nibley Park School, Highland High School, and Carden Memorial School.
Ownership History
Date
Name
Owned For
Owner Type
Purchase Details
Closed on
Apr 20, 2016
Sold by
Cardenas Fernando
Bought by
Cardenas Fernando
Current Estimated Value
Home Financials for this Owner
Home Financials are based on the most recent Mortgage that was taken out on this home.
Original Mortgage
$115,000
Outstanding Balance
$91,510
Interest Rate
3.73%
Mortgage Type
New Conventional
Estimated Equity
$285,203
Purchase Details
Closed on
Jul 31, 2014
Sold by
Jeanselme Brett Antone
Bought by
Cardenas Fernando
Home Financials for this Owner
Home Financials are based on the most recent Mortgage that was taken out on this home.
Original Mortgage
$116,000
Interest Rate
4.13%
Mortgage Type
New Conventional
Purchase Details
Closed on
Jun 6, 2012
Sold by
Dalebjout Dennis A and Gladys D Jacobsen Family Livin
Bought by
Jeanselme Brett Antone
Home Financials for this Owner
Home Financials are based on the most recent Mortgage that was taken out on this home.
Original Mortgage
$103,171
Interest Rate
3.84%
Mortgage Type
VA
Create a Home Valuation Report for This Property
The Home Valuation Report is an in-depth analysis detailing your home's value as well as a comparison with similar homes in the area
Home Values in the Area
Average Home Value in this Area
Purchase History
| Date | Buyer | Sale Price | Title Company |
|---|---|---|---|
| Cardenas Fernando | -- | Pinnacle Title Co | |
| Cardenas Fernando | -- | Cottonwood Title | |
| Jeanselme Brett Antone | -- | Artisan Title |
Source: Public Records
Mortgage History
| Date | Status | Borrower | Loan Amount |
|---|---|---|---|
| Open | Cardenas Fernando | $115,000 | |
| Closed | Cardenas Fernando | $116,000 | |
| Previous Owner | Jeanselme Brett Antone | $103,171 |
Source: Public Records
Tax History Compared to Growth
Tax History
| Year | Tax Paid | Tax Assessment Tax Assessment Total Assessment is a certain percentage of the fair market value that is determined by local assessors to be the total taxable value of land and additions on the property. | Land | Improvement |
|---|---|---|---|---|
| 2025 | $1,728 | $314,800 | $94,400 | $220,400 |
| 2024 | $1,728 | $329,800 | $98,900 | $230,900 |
| 2023 | $1,675 | $308,100 | $92,400 | $215,700 |
| 2022 | $1,869 | $322,500 | $96,700 | $225,800 |
| 2021 | $1,543 | $241,100 | $72,300 | $168,800 |
| 2020 | $1,445 | $214,800 | $64,400 | $150,400 |
| 2019 | $1,446 | $202,300 | $60,700 | $141,600 |
| 2018 | $1,343 | $183,000 | $54,900 | $128,100 |
| 2017 | $1,276 | $0 | $0 | $0 |
| 2016 | $1,182 | $143,300 | $43,000 | $100,300 |
| 2015 | $1,187 | $136,400 | $40,900 | $95,500 |
| 2014 | $1,185 | $135,000 | $40,500 | $94,500 |
Source: Public Records
Map
Nearby Homes
- 1130 E 2700 S Unit K83
- 1150 E 2700 S Unit G51
- 1150 E 2700 S Unit 50G
- 1152 E 2700 S Unit S148
- 1192 E 2700 S
- 1190 E 2700 S Unit A4
- 1190 E 2700 S Unit A1
- 2618 S 1100 E
- 2710 S Highland Dr Unit 11
- 2584 S Elizabeth St Unit 5
- 2760 S Highland Dr Unit 21
- 2760 S Highland Dr Unit 20
- 916 E Forest View Ave
- 2438 S Elizabeth St Unit 2
- 2430 S Elizabeth St Unit 5
- 1314 E Crandall Ave
- 1168 E Parkway Ave
- 876 Forest Park Ct
- 2400 S Elizabeth St Unit 4
- 1978 S Windsor Cir
- 1108 E 2700 S Unit B16
- 1108 E 2700 S Unit B11
- 1108 E 2700 S Unit B13
- 1108 E 2700 S Unit B12
- 1108 E 2700 S Unit B14
- 1108 E 2700 S Unit B15
- 1108 E 2700 S Unit B10
- 1108 E 2700 S Unit 9
- 1120 E 2700 S Unit J78
- 1120 E 2700 S Unit J75
- 1120 E 2700 S Unit J77
- 1120 E 2700 S Unit J74
- 1120 E 2700 S Unit J80
- 1120 E 2700 S Unit J79
- 1120 E 2700 S Unit J76
- 1120 E 2700 S Unit J73
- 1130 E 2700 S Unit K85
- 1130 E 2700 S Unit K82
- 1130 E 2700 S Unit K84
- 1130 E 2700 S Unit K88