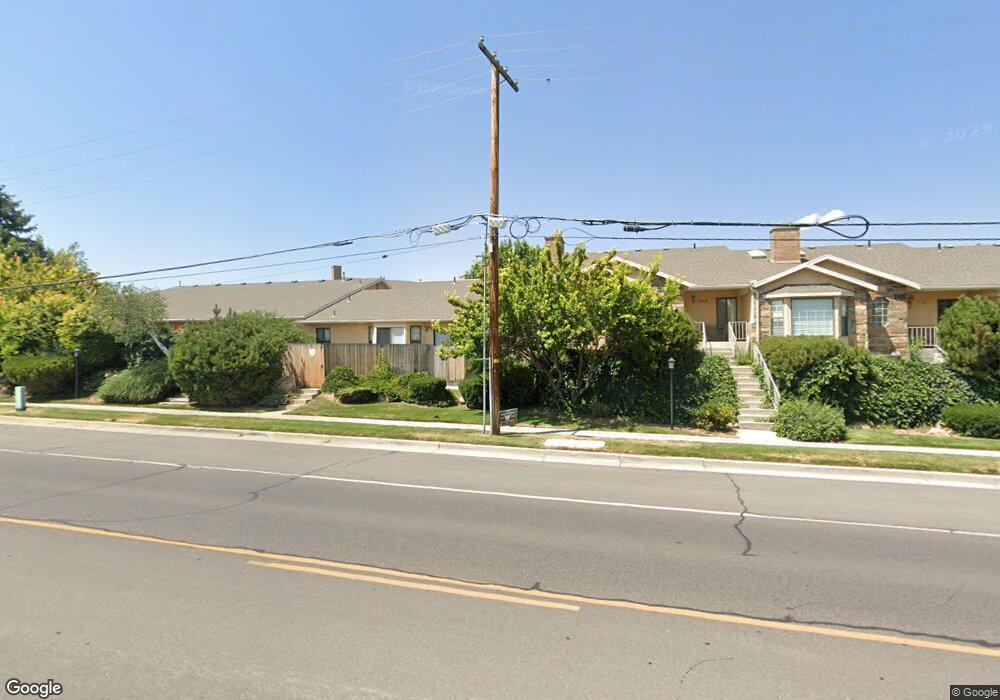
1108 E Loch Lomond Way Salt Lake City, UT 84117
Estimated Value: $457,000 - $531,000
3
Beds
3
Baths
1,890
Sq Ft
$259/Sq Ft
Est. Value
About This Home
This home is located at 1108 E Loch Lomond Way, Salt Lake City, UT 84117 and is currently estimated at $488,782, approximately $258 per square foot. 1108 E Loch Lomond Way is a home located in Salt Lake County with nearby schools including Twin Peaks Elementary School, James E Moss Elementary School, and Bonneville Junior High School.
Ownership History
Date
Name
Owned For
Owner Type
Purchase Details
Closed on
Sep 9, 2024
Sold by
Robbins Mark Joseph
Bought by
Su Tiffany Pay Shan
Current Estimated Value
Home Financials for this Owner
Home Financials are based on the most recent Mortgage that was taken out on this home.
Original Mortgage
$291,000
Outstanding Balance
$287,916
Interest Rate
6.78%
Mortgage Type
New Conventional
Estimated Equity
$200,866
Purchase Details
Closed on
Apr 29, 2022
Sold by
Engar Holly
Bought by
Robbins Mark Joseph
Home Financials for this Owner
Home Financials are based on the most recent Mortgage that was taken out on this home.
Original Mortgage
$459,000
Interest Rate
4.75%
Mortgage Type
New Conventional
Purchase Details
Closed on
Apr 21, 2022
Sold by
Holly Engar
Bought by
Robbins Mark Joseph
Home Financials for this Owner
Home Financials are based on the most recent Mortgage that was taken out on this home.
Original Mortgage
$459,000
Interest Rate
4.75%
Mortgage Type
New Conventional
Purchase Details
Closed on
May 5, 2021
Sold by
Holly Engar Living Trust and Engar Holly
Bought by
Engar Holly
Home Financials for this Owner
Home Financials are based on the most recent Mortgage that was taken out on this home.
Original Mortgage
$205,000
Interest Rate
2.4%
Mortgage Type
New Conventional
Purchase Details
Closed on
Apr 20, 2021
Sold by
Engar Holly and The Holly Engar Living Trust
Bought by
Engar Holly
Home Financials for this Owner
Home Financials are based on the most recent Mortgage that was taken out on this home.
Original Mortgage
$205,000
Interest Rate
2.4%
Mortgage Type
New Conventional
Purchase Details
Closed on
Feb 1, 2019
Sold by
Engar Holly
Bought by
Engar Holly and The Holly Engar Living Trust
Purchase Details
Closed on
Sep 5, 2017
Sold by
Panos Edward F
Bought by
Engar Holly
Purchase Details
Closed on
Aug 1, 2012
Sold by
Johnson Muriel P
Bought by
Johnson Muriel P and Muriel P Johnson Family Living Trust
Purchase Details
Closed on
Oct 1, 2001
Sold by
Breen Beverly N
Bought by
Johnson Muriel P
Purchase Details
Closed on
Dec 30, 2000
Sold by
Breen Beverly N
Bought by
Breen Beverly N
Purchase Details
Closed on
Dec 22, 1995
Sold by
Breen Beverly N
Bought by
Breen Beverly N
Create a Home Valuation Report for This Property
The Home Valuation Report is an in-depth analysis detailing your home's value as well as a comparison with similar homes in the area
Home Values in the Area
Average Home Value in this Area
Purchase History
| Date | Buyer | Sale Price | Title Company |
|---|---|---|---|
| Su Tiffany Pay Shan | -- | Title Guarantee | |
| Su Tiffany Pay Shan | -- | Title Guarantee | |
| Robbins Mark Joseph | -- | Us Title | |
| Robbins Mark Joseph | -- | Us Title | |
| Robbins Mark Joseph | -- | Us Title | |
| Robbins Mark Joseph | -- | Us Title | |
| Engar Holly | -- | Lsi Title | |
| Engar Holly | -- | Lsi Title | |
| Engar Holly | -- | Lsi Title Co | |
| Engar Holly | -- | Lsi Title Co | |
| Engar Holly | -- | None Available | |
| Engar Holly | -- | None Available | |
| Engar Holly | -- | First American Title | |
| Engar Holly | -- | First American Title | |
| Johnson Muriel P | -- | None Available | |
| Johnson Muriel P | -- | None Available | |
| Johnson Muriel P | -- | Associated Title | |
| Johnson Muriel P | -- | Associated Title | |
| Breen Beverly N | -- | -- | |
| Breen Beverly N | -- | -- | |
| Breen Beverly N | -- | -- | |
| Breen Beverly N | -- | -- |
Source: Public Records
Mortgage History
| Date | Status | Borrower | Loan Amount |
|---|---|---|---|
| Open | Su Tiffany Pay Shan | $291,000 | |
| Previous Owner | Robbins Mark Joseph | $459,000 | |
| Previous Owner | Robbins Mark Joseph | $459,000 | |
| Previous Owner | Engar Holly | $205,000 | |
| Previous Owner | Engar Holly | $205,000 |
Source: Public Records
Tax History Compared to Growth
Tax History
| Year | Tax Paid | Tax Assessment Tax Assessment Total Assessment is a certain percentage of the fair market value that is determined by local assessors to be the total taxable value of land and additions on the property. | Land | Improvement |
|---|---|---|---|---|
| 2025 | $3,009 | $474,100 | $142,200 | $331,900 |
| 2024 | $3,009 | $481,800 | $144,500 | $337,300 |
| 2023 | $3,009 | $452,700 | $135,800 | $316,900 |
| 2022 | $2,771 | $430,500 | $129,100 | $301,400 |
| 2021 | $2,697 | $363,300 | $109,000 | $254,300 |
| 2020 | $2,574 | $327,300 | $98,200 | $229,100 |
| 2019 | $2,329 | $289,300 | $86,800 | $202,500 |
| 2018 | $2,423 | $289,700 | $86,900 | $202,800 |
| 2017 | $2,045 | $256,300 | $76,900 | $179,400 |
| 2016 | $1,737 | $219,700 | $65,900 | $153,800 |
| 2015 | $1,766 | $209,100 | $62,700 | $146,400 |
| 2014 | $1,787 | $207,000 | $62,100 | $144,900 |
Source: Public Records
Map
Nearby Homes
- 1107 E Brigadoon Ct
- 4656 S Woodduck Ln Unit 4656
- 4738 Woodduck Ln
- 4570 S Woodduck Ln
- 4554 S Woodduck Ln
- 4587 S Woodduck Ln
- 4616 S Quail Vista Cove Unit I
- 4611 S Quail Vista Cove Unit C
- 1309 Hidden Creek Ct
- 1096 Quail Park Dr Unit F
- 1331 E Foxmont Ln
- 1342 E Saxony Place
- 1177 S 1140 E
- 1040 E Quail Park Dr Unit B
- 1248 E Freshman Cir
- 4979 S Camino Real
- 4979 S Eastridge Ln Unit 190
- 4978 S Del Prado St Unit B006
- 877 E 4900 S
- 4981 La Contessa St
- 1127 E Brigadoon Ct
- 1127 E Brigadoon Ct
- 1123 E Brigadoon Ct
- 1104 Loch Lomond Way
- 1123 E Brigadoon Ct
- 1099 E Brigadoon Ct
- 1099 E Brigadoon Ct
- 1103 E Brigadoon Ct
- 1119 E Brigadoon Ct
- 1123 E Murray Holladay Rd
- 1123 E Murray Holladay Rd
- 1119 E Murray Holladay Rd Unit 1119E
- 1119 E Murray Holladay Rd
- 1127 E Murray Holladay Rd Unit 1127E
- 1117 E Loch Lomond Way
- 1102 E Brigadoon Ct
- 1115 E Brigadoon Ct
- 1115 E Brigadoon Ct
- 1110 E Brigadoon Ct
- 1110 E Brigadoon Ct Unit 110 E