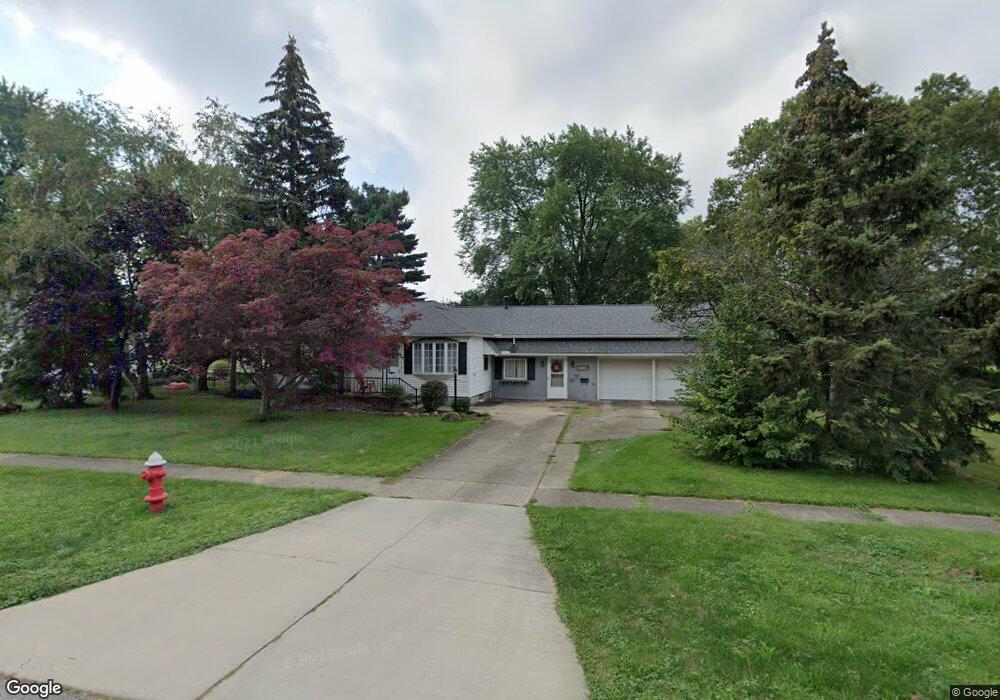
1108 Foster Ave Elyria, OH 44035
Estimated Value: $164,000 - $192,496
4
Beds
2
Baths
1,484
Sq Ft
$122/Sq Ft
Est. Value
About This Home
This home is located at 1108 Foster Ave, Elyria, OH 44035 and is currently estimated at $180,874, approximately $121 per square foot. 1108 Foster Ave is a home located in Lorain County with nearby schools including Westwood Middle School, Elyria High School, and St Mary Elementary School.
Ownership History
Date
Name
Owned For
Owner Type
Purchase Details
Closed on
Oct 3, 2001
Sold by
Early Billy R and Early Joyce E
Bought by
Mericle Jude Holly
Current Estimated Value
Home Financials for this Owner
Home Financials are based on the most recent Mortgage that was taken out on this home.
Original Mortgage
$86,400
Interest Rate
6.99%
Purchase Details
Closed on
Mar 20, 1998
Sold by
Millis Victor and Millis Debra A
Bought by
Early Billy Ray and Early Joyce Erlene
Home Financials for this Owner
Home Financials are based on the most recent Mortgage that was taken out on this home.
Original Mortgage
$99,960
Interest Rate
7.19%
Mortgage Type
VA
Purchase Details
Closed on
Aug 18, 1997
Sold by
Dages Robert C
Bought by
Millis Debra A and Millis Victor
Home Financials for this Owner
Home Financials are based on the most recent Mortgage that was taken out on this home.
Original Mortgage
$72,000
Interest Rate
9%
Mortgage Type
New Conventional
Create a Home Valuation Report for This Property
The Home Valuation Report is an in-depth analysis detailing your home's value as well as a comparison with similar homes in the area
Home Values in the Area
Average Home Value in this Area
Purchase History
| Date | Buyer | Sale Price | Title Company |
|---|---|---|---|
| Mericle Jude Holly | $108,000 | Midland Title | |
| Early Billy Ray | $98,000 | Midland Title | |
| Millis Debra A | $90,000 | -- |
Source: Public Records
Mortgage History
| Date | Status | Borrower | Loan Amount |
|---|---|---|---|
| Previous Owner | Mericle Jude Holly | $86,400 | |
| Previous Owner | Early Billy Ray | $99,960 | |
| Previous Owner | Millis Debra A | $72,000 |
Source: Public Records
Tax History
| Year | Tax Paid | Tax Assessment Tax Assessment Total Assessment is a certain percentage of the fair market value that is determined by local assessors to be the total taxable value of land and additions on the property. | Land | Improvement |
|---|---|---|---|---|
| 2024 | $2,748 | $56,693 | $12,719 | $43,974 |
| 2023 | $2,151 | $38,535 | $12,341 | $26,194 |
| 2022 | $2,144 | $38,535 | $12,341 | $26,194 |
| 2021 | $2,149 | $38,535 | $12,341 | $26,194 |
| 2020 | $2,017 | $32,170 | $10,300 | $21,870 |
| 2019 | $2,004 | $32,170 | $10,300 | $21,870 |
| 2018 | $1,029 | $32,170 | $10,300 | $21,870 |
| 2017 | $2,015 | $30,930 | $10,390 | $20,540 |
| 2016 | $1,989 | $30,930 | $10,390 | $20,540 |
| 2015 | $1,866 | $30,930 | $10,390 | $20,540 |
| 2014 | $1,941 | $32,560 | $10,940 | $21,620 |
| 2013 | $1,925 | $32,560 | $10,940 | $21,620 |
Source: Public Records
Map
Nearby Homes
- 1102 Foster Ave
- 380 Penfield Ave
- 374 Penfield Ave
- 1072 Foster Ave
- 370 Penfield Ave
- 1113 Foster Ave
- 1103 Foster Ave
- 1068 Foster Ave
- 381 Penfield Ave
- 364 Penfield Ave
- 375 Penfield Ave
- 1073 Foster Ave
- 1062 Foster Ave
- 371 Penfield Ave
- 360 Penfield Ave
- 1069 Foster Ave
- 365 Penfield Ave
- 308 Spruce St
- 306 Spruce St
- 380 Rockfern Ave
Your Personal Tour Guide
Ask me questions while you tour the home.