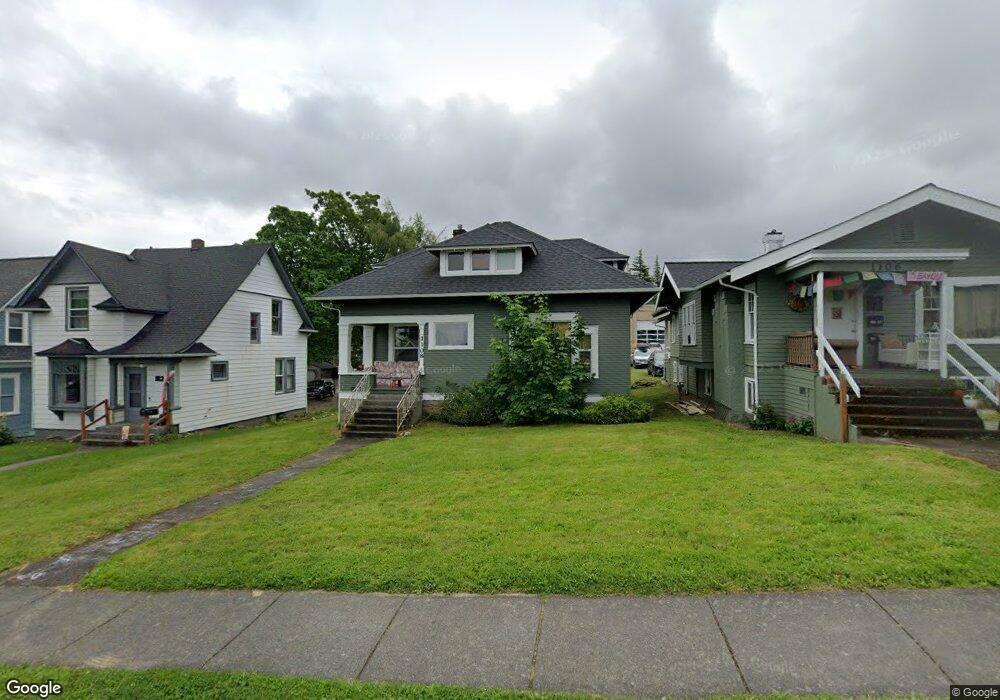
1108 High St Bellingham, WA 98225
Sehome NeighborhoodEstimated Value: $731,727 - $839,000
6
Beds
2
Baths
1,812
Sq Ft
$433/Sq Ft
Est. Value
About This Home
This home is located at 1108 High St, Bellingham, WA 98225 and is currently estimated at $783,932, approximately $432 per square foot. 1108 High St is a home located in Whatcom County with nearby schools including Lowell Elementary School, Fairhaven Middle School, and Sehome High School.
Ownership History
Date
Name
Owned For
Owner Type
Purchase Details
Closed on
Feb 3, 2015
Sold by
Kerr Robert H and Kerr Brenda L
Bought by
Kerr Properties & Investments Llc
Current Estimated Value
Purchase Details
Closed on
May 18, 1999
Sold by
Kerr Brenda
Bought by
Kerr Robert H
Create a Home Valuation Report for This Property
The Home Valuation Report is an in-depth analysis detailing your home's value as well as a comparison with similar homes in the area
Home Values in the Area
Average Home Value in this Area
Purchase History
| Date | Buyer | Sale Price | Title Company |
|---|---|---|---|
| Kerr Properties & Investments Llc | -- | None Available | |
| Kerr Robert H | -- | First American Title Ins |
Source: Public Records
Tax History Compared to Growth
Tax History
| Year | Tax Paid | Tax Assessment Tax Assessment Total Assessment is a certain percentage of the fair market value that is determined by local assessors to be the total taxable value of land and additions on the property. | Land | Improvement |
|---|---|---|---|---|
| 2024 | $5,364 | $672,128 | $269,395 | $402,733 |
| 2023 | $5,364 | $689,200 | $276,238 | $412,962 |
| 2022 | $4,380 | $594,148 | $238,140 | $356,008 |
| 2021 | $4,297 | $471,546 | $189,000 | $282,546 |
| 2020 | $4,509 | $436,617 | $175,000 | $261,617 |
| 2019 | $4,037 | $442,820 | $141,415 | $301,405 |
| 2018 | $4,065 | $397,485 | $126,965 | $270,520 |
| 2017 | $3,508 | $342,222 | $109,310 | $232,912 |
| 2016 | $3,069 | $308,656 | $98,090 | $210,566 |
| 2015 | $3,009 | $281,080 | $89,590 | $191,490 |
| 2014 | -- | $266,679 | $85,000 | $181,679 |
| 2013 | -- | $256,126 | $78,750 | $177,376 |
Source: Public Records
Map
Nearby Homes
- 1126 N Forest St
- 1309 Billy Frank Jr St
- 615 E Myrtle St
- 1031 N State St Unit 107
- 1031 N State St Unit 209
- 1001 N State St Unit 403
- 616 E Myrtle St
- 901 N Forest St Unit 107
- 901 N Forest St Unit 125
- 901 N Forest St Unit 109
- 1015 Railroad Ave Unit 418
- 1234 Grant St
- 1335 Humboldt St
- 5 XX Gladstone St
- 1205 E Maple St
- 310 E Ivy St
- 1125 Otis St
- 500 Gladstone St
- 508 Gladstone St
- 1025 Granary Ave Unit 503