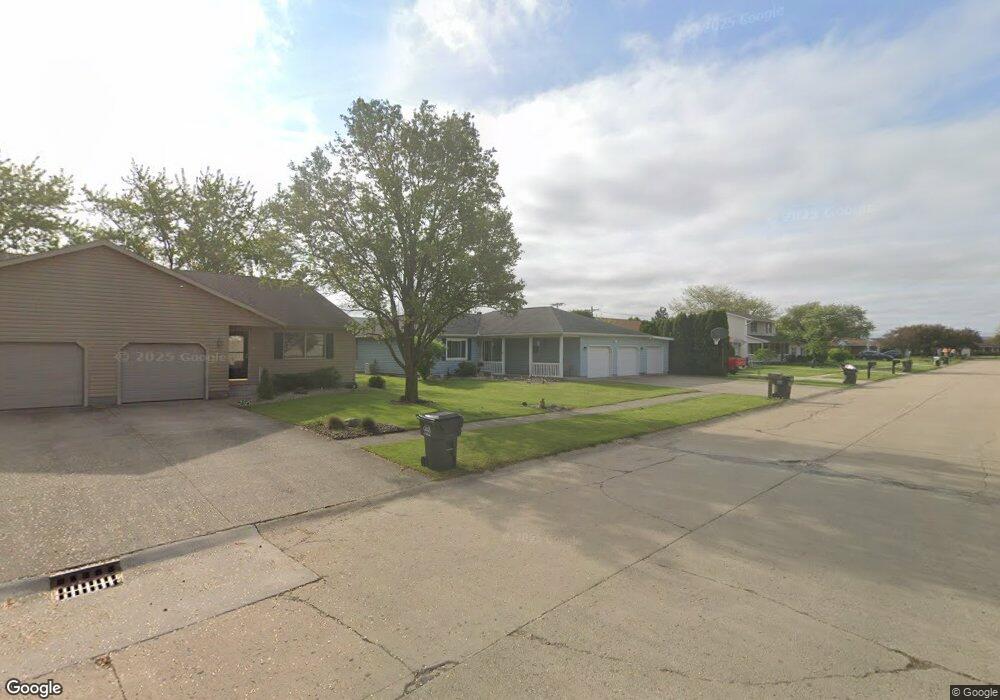
1108 Marsh Ave Delphos, OH 45833
Estimated Value: $236,000 - $300,000
3
Beds
2
Baths
1,612
Sq Ft
$162/Sq Ft
Est. Value
About This Home
This home is located at 1108 Marsh Ave, Delphos, OH 45833 and is currently estimated at $260,755, approximately $161 per square foot. 1108 Marsh Ave is a home located in Allen County with nearby schools including Delphos St. John's Elementary School.
Ownership History
Date
Name
Owned For
Owner Type
Purchase Details
Closed on
Sep 14, 2012
Sold by
Boes Philip C
Bought by
Boes Lynn M
Current Estimated Value
Purchase Details
Closed on
Oct 21, 2008
Sold by
Boes Philip C and Boes Lynn M
Bought by
Boes Philip C and Boes Lynn M
Purchase Details
Closed on
Feb 1, 1990
Bought by
Kimmey David A
Create a Home Valuation Report for This Property
The Home Valuation Report is an in-depth analysis detailing your home's value as well as a comparison with similar homes in the area
Home Values in the Area
Average Home Value in this Area
Purchase History
| Date | Buyer | Sale Price | Title Company |
|---|---|---|---|
| Boes Lynn M | -- | Attorney | |
| Boes Philip C | -- | Attorney | |
| Kimmey David A | $10,000 | -- |
Source: Public Records
Tax History
| Year | Tax Paid | Tax Assessment Tax Assessment Total Assessment is a certain percentage of the fair market value that is determined by local assessors to be the total taxable value of land and additions on the property. | Land | Improvement |
|---|---|---|---|---|
| 2024 | $1,482 | $57,760 | $9,280 | $48,480 |
| 2023 | $1,269 | $48,130 | $7,740 | $40,390 |
| 2022 | $1,314 | $48,130 | $7,740 | $40,390 |
| 2021 | $1,322 | $48,130 | $7,740 | $40,390 |
| 2020 | $1,062 | $41,900 | $7,280 | $34,620 |
| 2019 | $1,062 | $41,900 | $7,280 | $34,620 |
| 2018 | $1,059 | $41,900 | $7,280 | $34,620 |
| 2017 | $1,028 | $40,320 | $7,280 | $33,040 |
| 2016 | $1,042 | $40,320 | $7,280 | $33,040 |
| 2015 | $1,072 | $40,320 | $7,280 | $33,040 |
| 2014 | $1,072 | $41,160 | $7,000 | $34,160 |
| 2013 | $1,076 | $41,160 | $7,000 | $34,160 |
Source: Public Records
Map
Nearby Homes
- 1000 Colettas Way
- 821 E 3rd St
- 730 E 3rd St
- 810 N Franklin St
- 704 N Franklin St
- 610 N Washington St
- 405 N Franklin St
- 702 N Main St
- 201 E 5th St
- 629 N Main St
- 332 W 6th St
- 633 N Clay St
- 7110 Elida Rd
- 221 S Main St
- 409 N Bredeick St
- 483 S Franklin St
- 424 S Canal St
- 709 W 4th St
- 318 S Cass St
- 708 W 1st St