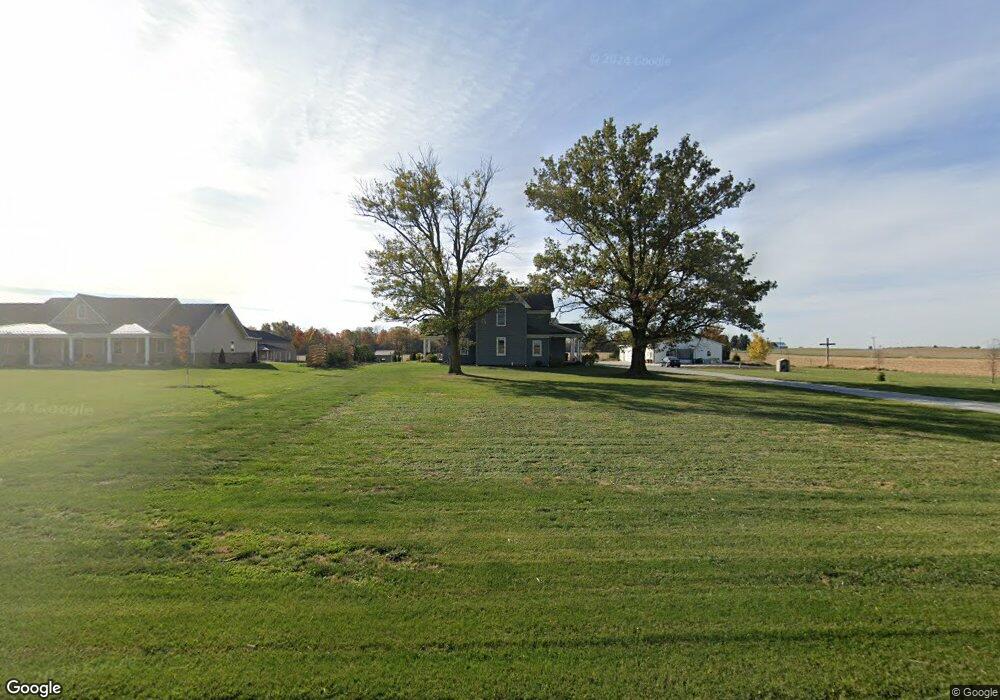
1108 Minster Fort Recovery Rd Minster, OH 45865
Estimated Value: $321,000 - $534,000
4
Beds
1
Bath
2,735
Sq Ft
$147/Sq Ft
Est. Value
About This Home
This home is located at 1108 Minster Fort Recovery Rd, Minster, OH 45865 and is currently estimated at $403,349, approximately $147 per square foot. 1108 Minster Fort Recovery Rd is a home with nearby schools including Minster Elementary School and Minster Junior/Senior High School.
Ownership History
Date
Name
Owned For
Owner Type
Purchase Details
Closed on
May 19, 2012
Sold by
Homan John R and Homan Jean H
Bought by
Homan John W and Homan Julia E
Current Estimated Value
Home Financials for this Owner
Home Financials are based on the most recent Mortgage that was taken out on this home.
Original Mortgage
$100,000
Interest Rate
4%
Mortgage Type
Purchase Money Mortgage
Purchase Details
Closed on
Dec 22, 2010
Sold by
Bruns Mary R
Bought by
Bruns James W and Bruns Roger E
Home Financials for this Owner
Home Financials are based on the most recent Mortgage that was taken out on this home.
Original Mortgage
$369,996
Outstanding Balance
$243,702
Interest Rate
4.16%
Mortgage Type
Seller Take Back
Estimated Equity
$159,647
Purchase Details
Closed on
Aug 10, 2010
Sold by
Bruns Mary R
Bought by
Homan John R and Homan Jean H
Purchase Details
Closed on
Sep 20, 1996
Sold by
Bruns Lawrence F
Bought by
Bruns Mary R
Purchase Details
Closed on
Jan 1, 1987
Create a Home Valuation Report for This Property
The Home Valuation Report is an in-depth analysis detailing your home's value as well as a comparison with similar homes in the area
Home Values in the Area
Average Home Value in this Area
Purchase History
| Date | Buyer | Sale Price | Title Company |
|---|---|---|---|
| Homan John W | $125,000 | Attorney | |
| Bruns James W | $380,000 | Attorney | |
| Homan John R | $150,000 | Attorney | |
| Bruns Mary R | -- | -- | |
| -- | $250,000 | -- |
Source: Public Records
Mortgage History
| Date | Status | Borrower | Loan Amount |
|---|---|---|---|
| Closed | Homan John W | $100,000 | |
| Open | Bruns James W | $369,996 |
Source: Public Records
Tax History Compared to Growth
Tax History
| Year | Tax Paid | Tax Assessment Tax Assessment Total Assessment is a certain percentage of the fair market value that is determined by local assessors to be the total taxable value of land and additions on the property. | Land | Improvement |
|---|---|---|---|---|
| 2024 | $6,750 | $97,160 | $13,990 | $83,170 |
| 2023 | $3,401 | $97,160 | $13,990 | $83,170 |
| 2022 | $2,434 | $63,440 | $12,720 | $50,720 |
| 2021 | $2,484 | $63,440 | $12,720 | $50,720 |
| 2020 | $1,277 | $63,438 | $12,716 | $50,722 |
| 2019 | $2,322 | $54,891 | $10,990 | $43,901 |
| 2018 | $2,341 | $55,349 | $10,990 | $44,359 |
| 2017 | $2,176 | $55,349 | $10,990 | $44,359 |
| 2016 | $1,767 | $44,342 | $9,863 | $34,479 |
| 2015 | $1,751 | $44,342 | $9,863 | $34,479 |
| 2014 | $1,790 | $44,342 | $9,863 | $34,479 |
| 2013 | $1,822 | $43,008 | $9,009 | $33,999 |
Source: Public Records
Map
Nearby Homes
- 2102 Thobe Ln
- 2109 Thobe Ln
- 2101 Thobe Ln
- 2093 Thobe Ln
- 2079 Thobe Ln
- 2065 Thobe Ln
- 47 N Frankfort St
- 17 Stonegate Dr
- 0 Stonegate Dr Unit 21 10544857
- 0 Stonegate Dr Unit 14 10544847
- 36 Shania Place Unit 23
- 27 Shania Place Unit 26
- 19 Shania Place Unit 33
- 28 Shania Place Unit 33
- 11 Shania Place Unit 28
- 193 N Paris St
- 561 S Walnut St Unit Lot3
- 323 Margaret St
- 319 Margaret St
- 316 Margaret St
- 1160 Minster Fort Recovery Rd
- 2736 State Route 364
- 2711 State Route 364
- 2671 State Route 364
- 2621 State Route 364
- 2621 State Route 364
- 2605 State Route 364
- 716 Minster Fort Recovery Rd
- 1556 Minster Fort Recovery Rd
- 2547 State Route 364
- 905 Minster Egypt Pike
- 2441 State Route 364
- 2438 State Route 364
- 1426 Minster Egypt Pike
- 1687 Minster Fort Recovery Rd
- 3544 State Route 364
- 3402 Sommers Rd
- 516 Minster Fort Recovery Rd
- 1850 Minster Fort Recovery Rd
- 1928 Minster Fort Recovery Rd