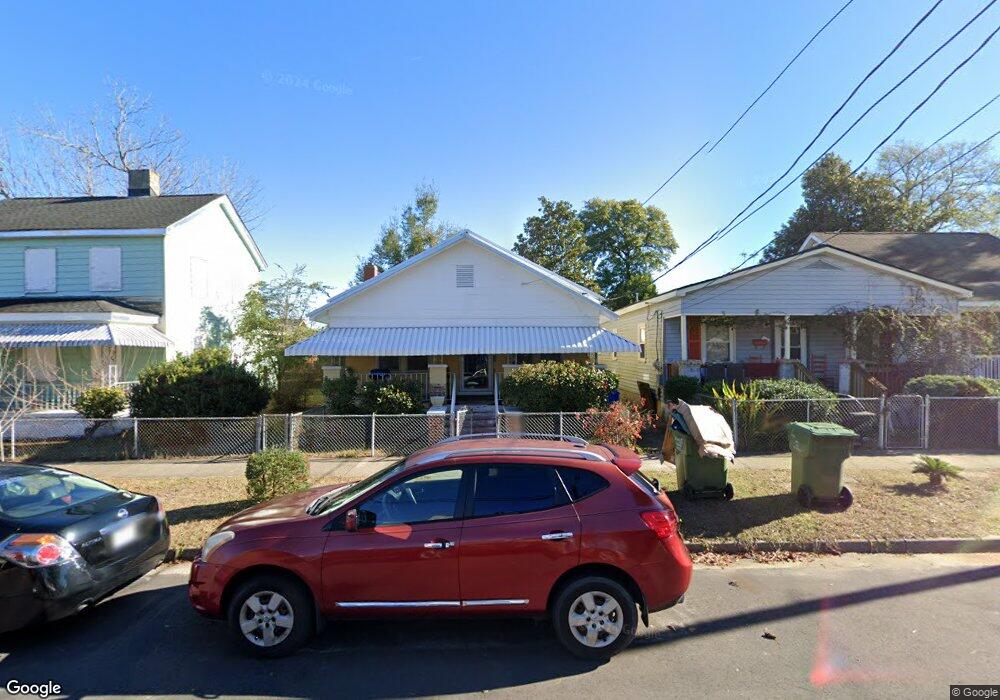
1108 N 6th St Wilmington, NC 28401
Northside NeighborhoodEstimated Value: $183,000 - $287,000
2
Beds
1
Bath
1,048
Sq Ft
$212/Sq Ft
Est. Value
About This Home
This home is located at 1108 N 6th St, Wilmington, NC 28401 and is currently estimated at $222,336, approximately $212 per square foot. 1108 N 6th St is a home located in New Hanover County with nearby schools including Snipes Academy of Arts & Design, Williston Middle School, and New Hanover High School.
Ownership History
Date
Name
Owned For
Owner Type
Purchase Details
Closed on
Aug 4, 2009
Sold by
Halsey Ruth G
Bought by
Boney Robert Lee and Boney Lucy Mae
Current Estimated Value
Home Financials for this Owner
Home Financials are based on the most recent Mortgage that was taken out on this home.
Original Mortgage
$56,250
Outstanding Balance
$36,488
Interest Rate
5.11%
Mortgage Type
New Conventional
Estimated Equity
$185,848
Purchase Details
Closed on
Jan 2, 1959
Sold by
Halsey Isabel
Bought by
Halsey Isabel Louise
Create a Home Valuation Report for This Property
The Home Valuation Report is an in-depth analysis detailing your home's value as well as a comparison with similar homes in the area
Home Values in the Area
Average Home Value in this Area
Purchase History
| Date | Buyer | Sale Price | Title Company |
|---|---|---|---|
| Boney Robert Lee | $75,000 | None Available | |
| Halsey Ruth | -- | None Available | |
| Halsey Isabel Louise | -- | -- |
Source: Public Records
Mortgage History
| Date | Status | Borrower | Loan Amount |
|---|---|---|---|
| Open | Boney Robert Lee | $56,250 |
Source: Public Records
Tax History Compared to Growth
Tax History
| Year | Tax Paid | Tax Assessment Tax Assessment Total Assessment is a certain percentage of the fair market value that is determined by local assessors to be the total taxable value of land and additions on the property. | Land | Improvement |
|---|---|---|---|---|
| 2024 | $829 | $95,300 | $43,200 | $52,100 |
| 2023 | $805 | $95,300 | $43,200 | $52,100 |
| 2022 | $810 | $95,300 | $43,200 | $52,100 |
| 2021 | $816 | $95,300 | $43,200 | $52,100 |
| 2020 | $609 | $57,800 | $13,500 | $44,300 |
| 2019 | $609 | $57,800 | $13,500 | $44,300 |
| 2018 | $609 | $57,800 | $13,500 | $44,300 |
| 2017 | $609 | $57,800 | $13,500 | $44,300 |
| 2016 | $779 | $70,300 | $16,800 | $53,500 |
| 2015 | $744 | $70,300 | $16,800 | $53,500 |
| 2014 | $713 | $70,300 | $16,800 | $53,500 |
Source: Public Records
Map
Nearby Homes