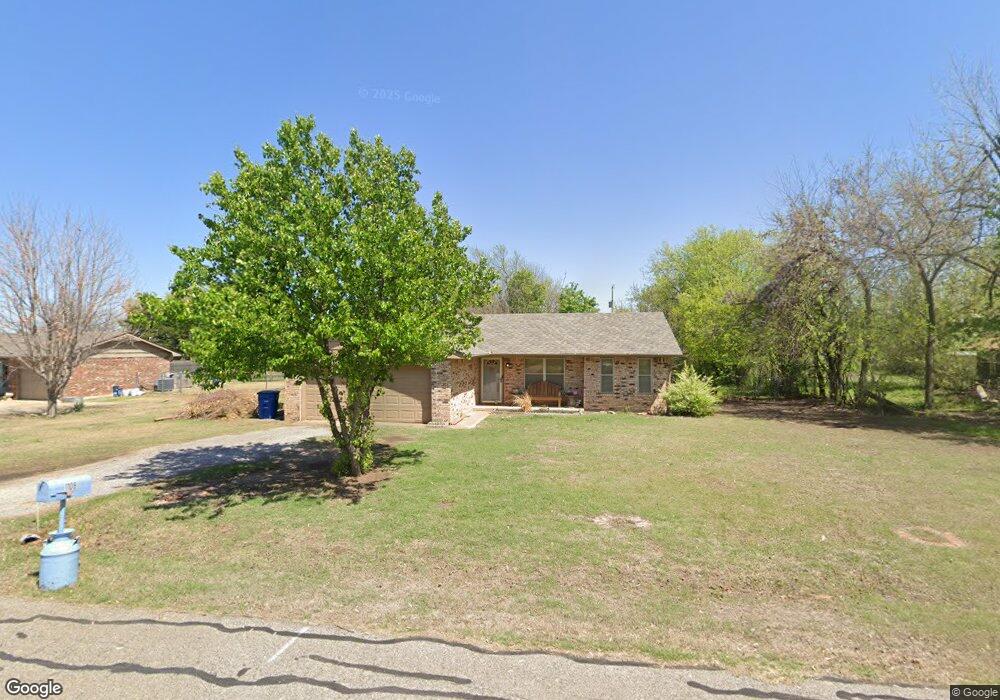
1108 N Doris Ave Newcastle, OK 73065
Estimated Value: $182,754 - $197,000
3
Beds
2
Baths
1,098
Sq Ft
$173/Sq Ft
Est. Value
About This Home
This home is located at 1108 N Doris Ave, Newcastle, OK 73065 and is currently estimated at $189,439, approximately $172 per square foot. 1108 N Doris Ave is a home located in McClain County with nearby schools including Newcastle Elementary School, Newcastle Middle School, and Newcastle High School.
Ownership History
Date
Name
Owned For
Owner Type
Purchase Details
Closed on
Jun 27, 2025
Sold by
Shetley Kaylee M
Bought by
Hall Darren Allen
Current Estimated Value
Home Financials for this Owner
Home Financials are based on the most recent Mortgage that was taken out on this home.
Original Mortgage
$199,192
Outstanding Balance
$198,855
Interest Rate
6.86%
Mortgage Type
VA
Estimated Equity
-$9,416
Purchase Details
Closed on
Mar 29, 2023
Sold by
Jones Vondella and Jones Kathryn E
Bought by
Shetley Kaylee M
Home Financials for this Owner
Home Financials are based on the most recent Mortgage that was taken out on this home.
Original Mortgage
$123,500
Interest Rate
6.32%
Mortgage Type
New Conventional
Purchase Details
Closed on
Mar 19, 2009
Sold by
Jones Vondella
Bought by
Jones Vondella and Harrmap Kathryn E
Create a Home Valuation Report for This Property
The Home Valuation Report is an in-depth analysis detailing your home's value as well as a comparison with similar homes in the area
Home Values in the Area
Average Home Value in this Area
Purchase History
| Date | Buyer | Sale Price | Title Company |
|---|---|---|---|
| Hall Darren Allen | $195,000 | Old Republic Title | |
| Hall Darren Allen | $195,000 | Old Republic Title | |
| Shetley Kaylee M | $130,000 | Old Republic Title | |
| Jones Vondella | -- | None Available |
Source: Public Records
Mortgage History
| Date | Status | Borrower | Loan Amount |
|---|---|---|---|
| Open | Hall Darren Allen | $199,192 | |
| Closed | Hall Darren Allen | $199,192 | |
| Previous Owner | Shetley Kaylee M | $123,500 | |
| Closed | Shetley Kaylee M | $4,322 |
Source: Public Records
Tax History Compared to Growth
Tax History
| Year | Tax Paid | Tax Assessment Tax Assessment Total Assessment is a certain percentage of the fair market value that is determined by local assessors to be the total taxable value of land and additions on the property. | Land | Improvement |
|---|---|---|---|---|
| 2025 | $1,647 | $14,171 | $2,640 | $11,531 |
| 2024 | $1,647 | $14,365 | $2,640 | $11,725 |
| 2023 | $1,647 | $5,668 | $805 | $4,863 |
| 2022 | $423 | $5,668 | $805 | $4,863 |
| 2021 | $565 | $5,668 | $805 | $4,863 |
| 2020 | $446 | $5,668 | $805 | $4,863 |
| 2019 | $453 | $5,668 | $495 | $5,173 |
| 2018 | $446 | $5,668 | $495 | $5,173 |
| 2017 | $445 | $5,668 | $495 | $5,173 |
| 2016 | $447 | $5,668 | $495 | $5,173 |
| 2015 | $447 | $5,668 | $495 | $5,173 |
| 2014 | $441 | $5,668 | $495 | $5,173 |
Source: Public Records
Map
Nearby Homes
- 1100 N Doris Ave
- 1109 N Doris Ave
- 1013 N Carr Dr
- 375 NE 9th Place
- 303 Naomi Ln
- 908 NW 6th St
- 820 NW 5th St
- 808 Saint James Place
- 1009 NW 5th St
- 1657 Autumn Lane Ct
- 1012 NW 5th St
- 1009 NW 17th St
- 1116 Vermont Ave
- 2 S Main St
- 3 S Main St
- 1 S Main St
- 4 S Main St
- 5 S Main St
- 6 S Main St
- 501 Saint James Place
- 1112 N Doris Ave
- 1109 N Carr Dr
- 1113 N Carr Dr
- 1120 N Doris Ave
- 1101 N Carr Dr
- 1020 N Doris Ave
- 1113 N Doris Ave
- 1101 N Doris Ave
- 1021 N Carr Dr
- 1121 N Doris Ave
- 1204 N Doris Ave
- 1012 N Doris Ave
- 1205 N Doris Ave
- 1205 N Carr Dr
- 1205 N Carr Dr
- 1013 N Doris Ave
- 1108 N Melinda Ave
- 1008 N Doris Ave Unit NCA
- 1100 N Melinda Ave
- 1108 N Carr Dr