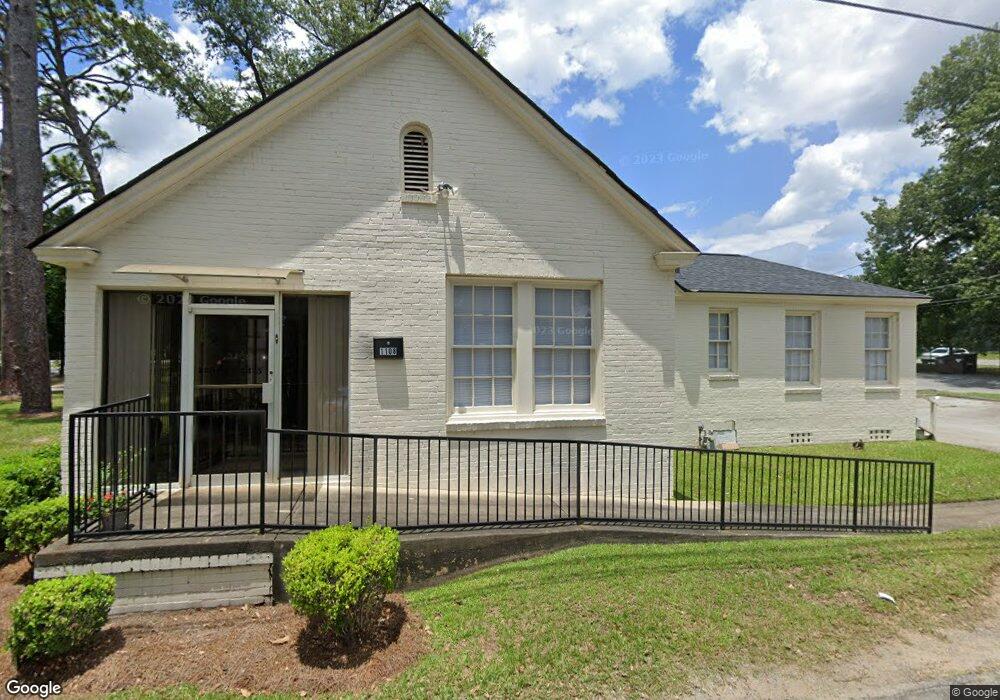
1108 N Jefferson St Albany, GA 31701
Albany Historic District NeighborhoodEstimated Value: $176,000 - $264,000
4
Beds
3
Baths
2,222
Sq Ft
$91/Sq Ft
Est. Value
About This Home
This home is located at 1108 N Jefferson St, Albany, GA 31701 and is currently estimated at $203,301, approximately $91 per square foot. 1108 N Jefferson St is a home located in Dougherty County with nearby schools including Northside Elementary School, Albany Middle School, and Albany High School.
Ownership History
Date
Name
Owned For
Owner Type
Purchase Details
Closed on
Oct 21, 2025
Sold by
Pearl Martin Llc
Bought by
Phoebe Putney Health System Inc
Current Estimated Value
Purchase Details
Closed on
Jun 25, 2014
Sold by
Martin John Paul
Bought by
Pearl Martin Llc
Home Financials for this Owner
Home Financials are based on the most recent Mortgage that was taken out on this home.
Original Mortgage
$96,000
Interest Rate
4.17%
Mortgage Type
New Conventional
Purchase Details
Closed on
Oct 18, 2010
Sold by
Val Land Inc
Bought by
Spectrum Doctors Laboratory Llc
Purchase Details
Closed on
Mar 3, 1994
Sold by
Flint River Girl Sco
Bought by
Val-Land Inc
Purchase Details
Closed on
Feb 3, 1975
Sold by
Albany Polls Inc
Bought by
Flint River Girl Sct
Create a Home Valuation Report for This Property
The Home Valuation Report is an in-depth analysis detailing your home's value as well as a comparison with similar homes in the area
Home Values in the Area
Average Home Value in this Area
Purchase History
| Date | Buyer | Sale Price | Title Company |
|---|---|---|---|
| Phoebe Putney Health System Inc | $180,000 | -- | |
| Pearl Martin Llc | -- | -- | |
| Martin John Paul | $120,000 | -- | |
| Spectrum Doctors Laboratory Llc | $200,000 | -- | |
| Val-Land Inc | $90,000 | -- | |
| Flint River Girl Sct | -- | -- |
Source: Public Records
Mortgage History
| Date | Status | Borrower | Loan Amount |
|---|---|---|---|
| Previous Owner | Martin John Paul | $96,000 |
Source: Public Records
Tax History Compared to Growth
Tax History
| Year | Tax Paid | Tax Assessment Tax Assessment Total Assessment is a certain percentage of the fair market value that is determined by local assessors to be the total taxable value of land and additions on the property. | Land | Improvement |
|---|---|---|---|---|
| 2024 | $2,269 | $47,560 | $7,720 | $39,840 |
| 2023 | $2,216 | $47,560 | $7,720 | $39,840 |
| 2022 | $2,224 | $47,560 | $7,720 | $39,840 |
| 2021 | $2,062 | $47,560 | $7,720 | $39,840 |
| 2020 | $2,067 | $47,560 | $7,720 | $39,840 |
| 2019 | $2,075 | $47,560 | $7,720 | $39,840 |
| 2018 | $2,083 | $47,560 | $7,720 | $39,840 |
| 2017 | $1,941 | $47,560 | $7,720 | $39,840 |
| 2016 | $1,942 | $47,560 | $7,720 | $39,840 |
| 2015 | $1,947 | $47,560 | $7,720 | $39,840 |
| 2014 | $2,162 | $53,480 | $13,640 | $39,840 |
Source: Public Records
Map
Nearby Homes
- 305 6th Ave
- 303 6th Ave
- 910 N Jackson St
- 804 N Jefferson St
- 1207 N Madison St
- 610 W 2nd Ave
- 526 10th Ave
- 1107 N Davis St
- 631 W 3rd Ave
- 903 N Davis St
- 507 N Jackson St
- 711 W 2nd Ave
- 634 11th Ave
- 707 8th Ave
- 703 9th Ave
- 800 7th Ave
- 717 8th Ave
- 714 9th Ave
- 1640 Arlington Park Cir
- 1648 Arlington Park Cir