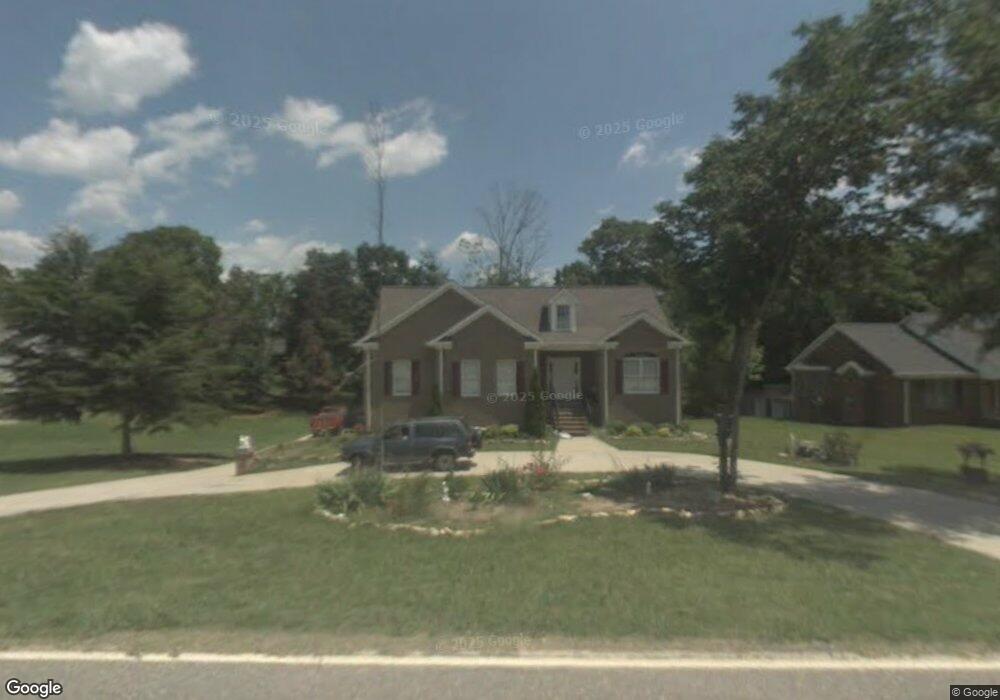
1108 Noah Rd Graham, NC 27253
Estimated Value: $337,000 - $376,116
3
Beds
3
Baths
2,067
Sq Ft
$173/Sq Ft
Est. Value
About This Home
This home is located at 1108 Noah Rd, Graham, NC 27253 and is currently estimated at $358,029, approximately $173 per square foot. 1108 Noah Rd is a home located in Alamance County with nearby schools including North Graham Elementary School, Southern Alamance Middle School, and Southern Alamance High School.
Ownership History
Date
Name
Owned For
Owner Type
Purchase Details
Closed on
Aug 14, 2009
Sold by
Harper Samuel Martin
Bought by
Rogers Harold
Current Estimated Value
Home Financials for this Owner
Home Financials are based on the most recent Mortgage that was taken out on this home.
Original Mortgage
$186,558
Outstanding Balance
$121,947
Interest Rate
5.26%
Mortgage Type
FHA
Estimated Equity
$236,082
Purchase Details
Closed on
Dec 1, 2008
Sold by
Sub Tr Svrs Inc
Bought by
Harper Samuel
Home Financials for this Owner
Home Financials are based on the most recent Mortgage that was taken out on this home.
Original Mortgage
$105,900
Interest Rate
6.01%
Mortgage Type
New Conventional
Purchase Details
Closed on
Jan 16, 2003
Sold by
Euliss Inc
Bought by
Devaladez Maria G Maya
Home Financials for this Owner
Home Financials are based on the most recent Mortgage that was taken out on this home.
Original Mortgage
$158,400
Interest Rate
6.16%
Mortgage Type
New Conventional
Create a Home Valuation Report for This Property
The Home Valuation Report is an in-depth analysis detailing your home's value as well as a comparison with similar homes in the area
Home Values in the Area
Average Home Value in this Area
Purchase History
| Date | Buyer | Sale Price | Title Company |
|---|---|---|---|
| Rogers Harold | $190,000 | -- | |
| Harper Samuel | $133,000 | -- | |
| Devaladez Maria G Maya | $198,000 | -- |
Source: Public Records
Mortgage History
| Date | Status | Borrower | Loan Amount |
|---|---|---|---|
| Open | Rogers Harold | $186,558 | |
| Previous Owner | Harper Samuel | $105,900 | |
| Previous Owner | Devaladez Maria G Maya | $158,400 |
Source: Public Records
Tax History
| Year | Tax Paid | Tax Assessment Tax Assessment Total Assessment is a certain percentage of the fair market value that is determined by local assessors to be the total taxable value of land and additions on the property. | Land | Improvement |
|---|---|---|---|---|
| 2025 | $1,965 | $397,858 | $30,972 | $366,886 |
| 2024 | $1,866 | $397,858 | $30,972 | $366,886 |
| 2023 | $1,710 | $397,858 | $30,972 | $366,886 |
| 2022 | $1,886 | $171,208 | $25,931 | $145,277 |
| 2021 | $1,903 | $171,208 | $25,931 | $145,277 |
| 2020 | $1,920 | $171,208 | $25,931 | $145,277 |
| 2019 | $1,926 | $171,208 | $25,931 | $145,277 |
| 2018 | $0 | $171,208 | $25,931 | $145,277 |
| 2017 | $988 | $171,208 | $25,931 | $145,277 |
| 2016 | $1,734 | $167,556 | $27,055 | $140,501 |
| 2015 | $971 | $168,283 | $27,055 | $141,228 |
| 2014 | $887 | $168,283 | $27,055 | $141,228 |
Source: Public Records
Map
Nearby Homes
- Tbd Woody Dr
- 1236 Woody Dr
- 1245 Woody Dr
- 1089 Valley Dr
- 944 Sunset Dr
- 1214 Raspberry Run
- 1619 Riverwalk Dr
- 317 Clapp St
- 1970 Riverwalk Dr
- 908 Jimmie Kerr Rd
- 0 Jimmie Kerr Rd Unit 10127526
- 1002 Ivey Rd
- 1811 Challenge Dr
- 0 Trollinger Rd
- 690 Maple Branch Cir
- 658 Maple Branch Cir
- 1402 Cherry Ln
- 301 Jones St
- 1832 Jimmie Kerr Rd
- 317 Single Tree Cir
Your Personal Tour Guide
Ask me questions while you tour the home.