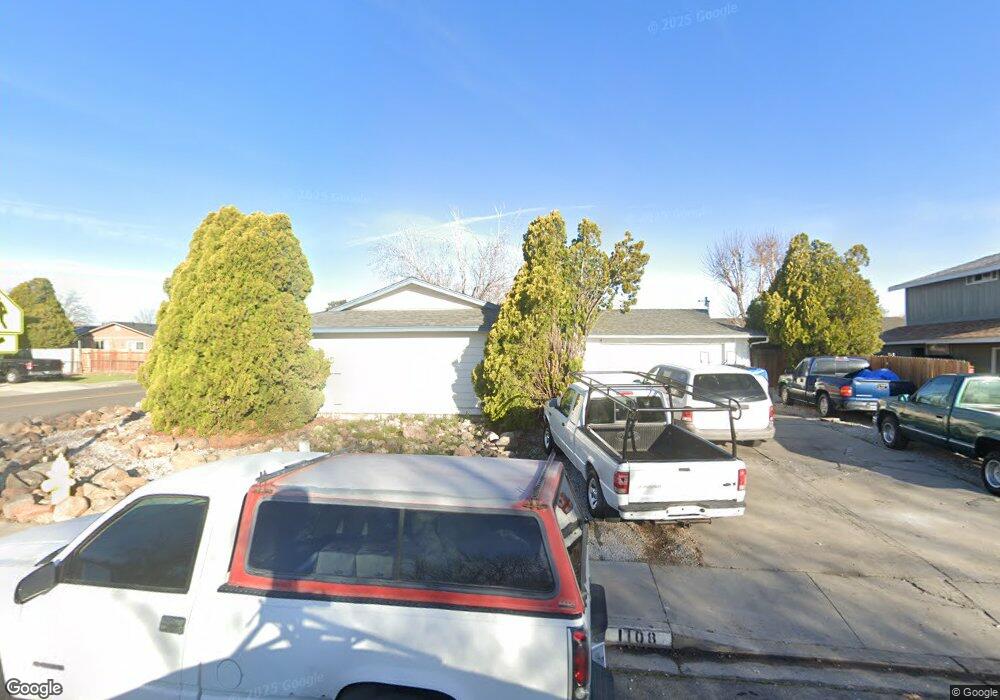
1108 O Callaghan Dr Sparks, NV 89434
O'Callaghan NeighborhoodEstimated Value: $383,000 - $420,000
3
Beds
2
Baths
1,210
Sq Ft
$337/Sq Ft
Est. Value
About This Home
This home is located at 1108 O Callaghan Dr, Sparks, NV 89434 and is currently estimated at $408,177, approximately $337 per square foot. 1108 O Callaghan Dr is a home located in Washoe County with nearby schools including Katherine Dunn Elementary School, George L Dilworth Middle School, and Edward C Reed High School.
Ownership History
Date
Name
Owned For
Owner Type
Purchase Details
Closed on
Nov 11, 2009
Sold by
Berkovatz James A and Berkovatz Diane L
Bought by
Brown Ronald L and Brown Lori S
Current Estimated Value
Home Financials for this Owner
Home Financials are based on the most recent Mortgage that was taken out on this home.
Original Mortgage
$78,000
Interest Rate
4.93%
Mortgage Type
New Conventional
Purchase Details
Closed on
Aug 1, 2005
Sold by
Berkovatz Diane L and Berkovatz James A
Bought by
Berkovatz James A and Berkovatz Diane L
Home Financials for this Owner
Home Financials are based on the most recent Mortgage that was taken out on this home.
Original Mortgage
$180,000
Interest Rate
5.56%
Mortgage Type
New Conventional
Purchase Details
Closed on
Jul 23, 1998
Sold by
Melton Darren T
Bought by
Melton Diane L
Create a Home Valuation Report for This Property
The Home Valuation Report is an in-depth analysis detailing your home's value as well as a comparison with similar homes in the area
Home Values in the Area
Average Home Value in this Area
Purchase History
| Date | Buyer | Sale Price | Title Company |
|---|---|---|---|
| Brown Ronald L | $97,500 | First American Title Reno | |
| Berkovatz James A | -- | Pacific Corporate & Title Se | |
| Melton Diane L | -- | -- |
Source: Public Records
Mortgage History
| Date | Status | Borrower | Loan Amount |
|---|---|---|---|
| Previous Owner | Brown Ronald L | $78,000 | |
| Previous Owner | Berkovatz James A | $180,000 |
Source: Public Records
Tax History Compared to Growth
Tax History
| Year | Tax Paid | Tax Assessment Tax Assessment Total Assessment is a certain percentage of the fair market value that is determined by local assessors to be the total taxable value of land and additions on the property. | Land | Improvement |
|---|---|---|---|---|
| 2025 | $1,436 | $57,002 | $37,275 | $19,727 |
| 2024 | $1,436 | $52,060 | $32,620 | $19,440 |
| 2023 | $1,331 | $49,693 | $31,710 | $17,983 |
| 2022 | $1,233 | $42,127 | $27,475 | $14,652 |
| 2021 | $1,143 | $36,310 | $21,175 | $15,135 |
| 2020 | $1,070 | $36,204 | $20,510 | $15,694 |
| 2019 | $1,019 | $34,500 | $18,865 | $15,635 |
| 2018 | $973 | $29,175 | $13,405 | $15,770 |
| 2017 | $934 | $28,973 | $12,810 | $16,163 |
| 2016 | $911 | $29,288 | $12,355 | $16,933 |
| 2015 | $910 | $27,264 | $9,695 | $17,569 |
| 2014 | $881 | $25,766 | $8,435 | $17,331 |
| 2013 | -- | $23,540 | $6,055 | $17,485 |
Source: Public Records
Map
Nearby Homes
- 1897 Bonita Vista Dr
- 1973 Rio Tinto Dr
- 1970 Woodhaven Ln
- 1544 Woodhaven Ln
- 1728 Bluehaven Dr
- 1218 Junction Dr
- 1990 Fargo Way
- 1051 Glen Martin Dr
- 913 Glen Molly Dr
- 1332 Coachman Ct
- 949 Crestwood Dr Unit 3
- 857 Cherry Tree Dr Unit 3
- 1095 E York Way
- 848 Parkside Dr Unit 1
- 801 Woodglen Dr Unit 2
- 745 Glen Vista Dr
- 2435 Sycamore Glen Dr Unit 2
- 2407 Sunny Slope Dr Unit 1
- 1770 Burnside Dr
- 2252 Sycamore Glen Dr
- 1114 O Callaghan Dr
- 1800 Bonita Vista Dr
- 1812 Bonita Vista Dr
- 1061 Norris Dr Unit 5B
- 1118 O Callaghan Dr
- 1782 Bonita Vista Dr
- 1826 Bonita Vista Dr
- 1124 O Callaghan Dr
- 1068 O Callaghan Dr
- 1068 O'Callaghan Dr
- 1124 O'Callaghan Dr
- 1836 Bonita Vista Dr
- 1722 Bonita Vista Dr
- 1030 Norris Dr
- 1813 Bonita Vista Dr
- 1031 Norris Dr
- 1010 San Miguel Way
- 1128 O Callaghan Dr
- 1827 Bonita Vista Dr
- 1058 O Callaghan Dr