Estimated Value: $233,187 - $263,000
3
Beds
2
Baths
1,071
Sq Ft
$228/Sq Ft
Est. Value
About This Home
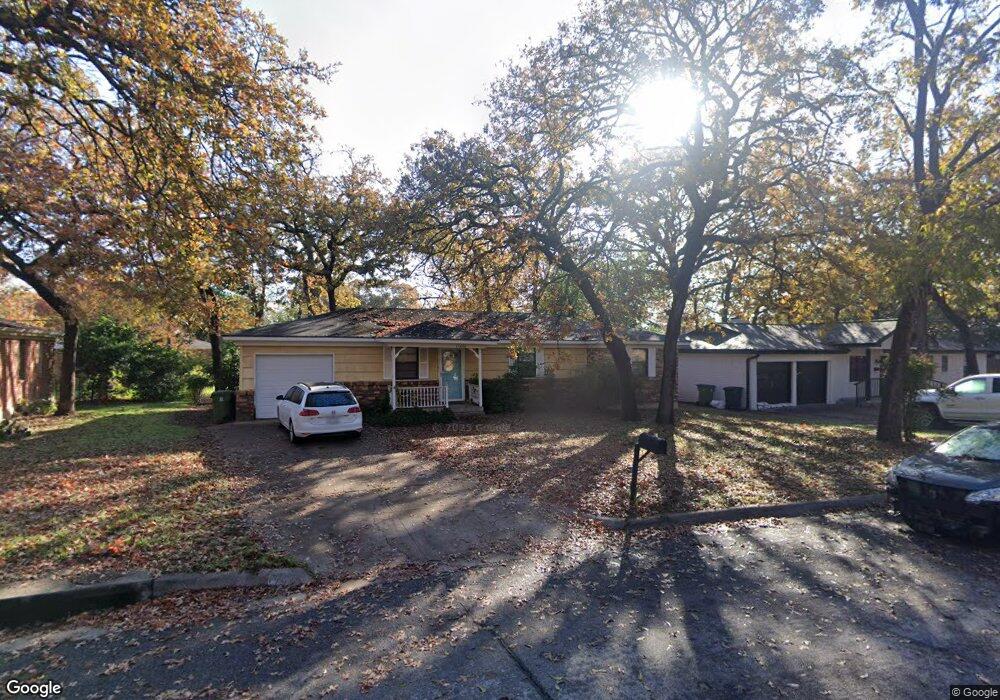
This home is located at 1108 Reed St, Hurst, TX 76053 and is currently estimated at $244,547, approximately $228 per square foot. 1108 Reed St is a home located in Tarrant County with nearby schools including Harrison Lane Elementary School, Hurst J High School, and L.D. Bell High School.
Ownership History
Date
Name
Owned For
Owner Type
Purchase Details
Closed on
Oct 8, 2019
Sold by
Mckinney Tracy
Bought by
Mckinney James
Current Estimated Value
Purchase Details
Closed on
Mar 31, 2010
Sold by
Stokes Glenn and Vaught Elaine C
Bought by
Mckinney James S and Mckinney Tracy
Home Financials for this Owner
Home Financials are based on the most recent Mortgage that was taken out on this home.
Original Mortgage
$78,551
Outstanding Balance
$52,628
Interest Rate
5.12%
Mortgage Type
FHA
Estimated Equity
$191,919
Purchase Details
Closed on
Apr 24, 1997
Sold by
Peek James W
Bought by
Peek Barbara G
Create a Home Valuation Report for This Property
The Home Valuation Report is an in-depth analysis detailing your home's value as well as a comparison with similar homes in the area
Home Values in the Area
Average Home Value in this Area
Purchase History
| Date | Buyer | Sale Price | Title Company |
|---|---|---|---|
| Mckinney James | -- | None Available | |
| Mckinney James S | -- | Fidelity National Title Agen | |
| Peek Barbara G | -- | -- |
Source: Public Records
Mortgage History
| Date | Status | Borrower | Loan Amount |
|---|---|---|---|
| Open | Mckinney James S | $78,551 |
Source: Public Records
Tax History
| Year | Tax Paid | Tax Assessment Tax Assessment Total Assessment is a certain percentage of the fair market value that is determined by local assessors to be the total taxable value of land and additions on the property. | Land | Improvement |
|---|---|---|---|---|
| 2025 | $2,040 | $230,677 | $55,000 | $175,677 |
| 2024 | $2,040 | $230,677 | $55,000 | $175,677 |
| 2023 | $3,015 | $220,213 | $40,000 | $180,213 |
| 2022 | $3,150 | $190,385 | $40,000 | $150,385 |
| 2021 | $2,999 | $157,992 | $40,000 | $117,992 |
| 2020 | $2,720 | $148,758 | $40,000 | $108,758 |
| 2019 | $2,516 | $136,477 | $40,000 | $96,477 |
| 2018 | $1,797 | $93,436 | $19,000 | $74,436 |
| 2017 | $2,149 | $115,189 | $19,000 | $96,189 |
| 2016 | $1,954 | $99,895 | $19,000 | $80,895 |
| 2015 | $1,481 | $70,200 | $15,000 | $55,200 |
| 2014 | $1,481 | $70,200 | $15,000 | $55,200 |
Source: Public Records
Map
Nearby Homes
- 1016 Keith Dr
- 1113 Norwood Dr
- 153 Sheri Ln
- 1112 Karla Dr
- 1236 Harrison Ln
- 209 W Cedar St
- 905 Brown Trail
- 701 Harrison Ln
- 629 Harrison Ln
- 802 Brown Trail
- 624 Forest Ln
- 609 Norwood Dr
- 1352 Simpson Dr
- 1348 Norwood Dr
- 341 Hurst Dr
- 344 Bedford Ct E
- 1213 Glenda Dr
- 552 Norwood Dr
- 813 Chase Cir
- 709 Hurstview Dr
Your Personal Tour Guide
Ask me questions while you tour the home.