Estimated Value: $203,000 - $240,000
3
Beds
2
Baths
1,276
Sq Ft
$169/Sq Ft
Est. Value
About This Home
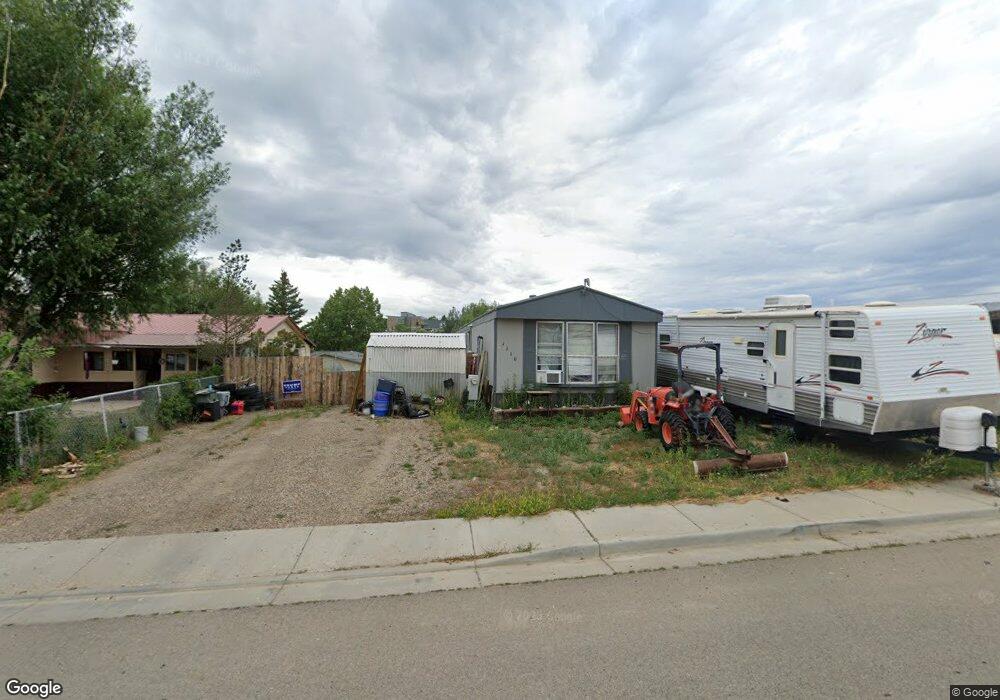
This home is located at 1108 Sequoia Ave, Craig, CO 81625 and is currently estimated at $215,727, approximately $169 per square foot. 1108 Sequoia Ave is a home located in Moffat County with nearby schools including Ridgeview Elementary School, Moffat County High School, and Calvary Baptist School.
Ownership History
Date
Name
Owned For
Owner Type
Purchase Details
Closed on
Aug 1, 2019
Sold by
Taylor Tiffany A
Bought by
Augustine Nicholas O and Mcclintock Keisha M
Current Estimated Value
Home Financials for this Owner
Home Financials are based on the most recent Mortgage that was taken out on this home.
Original Mortgage
$79,000
Outstanding Balance
$50,181
Interest Rate
3.8%
Mortgage Type
Commercial
Estimated Equity
$165,546
Purchase Details
Closed on
Mar 1, 2013
Sold by
Taylor Eric M
Bought by
Taylor Tiffany A
Home Financials for this Owner
Home Financials are based on the most recent Mortgage that was taken out on this home.
Original Mortgage
$79,788
Interest Rate
3.75%
Mortgage Type
FHA
Purchase Details
Closed on
Apr 15, 2008
Sold by
Beran Rainer E and Bernan Sandra F
Bought by
Taylor Eric M and Taylor Tiffany A
Home Financials for this Owner
Home Financials are based on the most recent Mortgage that was taken out on this home.
Original Mortgage
$84,671
Interest Rate
6%
Mortgage Type
FHA
Create a Home Valuation Report for This Property
The Home Valuation Report is an in-depth analysis detailing your home's value as well as a comparison with similar homes in the area
Purchase History
| Date | Buyer | Sale Price | Title Company |
|---|---|---|---|
| Augustine Nicholas O | $105,000 | None Available | |
| Augustine Nicholas O | $105,000 | None Available | |
| Taylor Tiffany A | -- | None Available | |
| Taylor Tiffany A | -- | None Available | |
| Taylor Eric M | $86,000 | None Available | |
| Taylor Eric M | $86,000 | None Available |
Source: Public Records
Mortgage History
| Date | Status | Borrower | Loan Amount |
|---|---|---|---|
| Open | Augustine Nicholas O | $79,000 | |
| Previous Owner | Taylor Tiffany A | $79,788 | |
| Previous Owner | Taylor Eric M | $84,671 |
Source: Public Records
Tax History
| Year | Tax Paid | Tax Assessment Tax Assessment Total Assessment is a certain percentage of the fair market value that is determined by local assessors to be the total taxable value of land and additions on the property. | Land | Improvement |
|---|---|---|---|---|
| 2025 | $767 | $10,534 | $0 | $0 |
| 2024 | $767 | $5,890 | $0 | $0 |
| 2023 | $399 | $5,890 | $950 | $4,940 |
| 2022 | $476 | $7,290 | $1,600 | $5,690 |
| 2021 | $478 | $7,490 | $1,640 | $5,850 |
| 2020 | $407 | $6,480 | $1,640 | $4,840 |
| 2019 | $320 | $5,160 | $1,640 | $3,520 |
| 2018 | $288 | $4,620 | $1,660 | $2,960 |
| 2017 | $300 | $4,620 | $1,660 | $2,960 |
| 2016 | $333 | $5,350 | $1,830 | $3,520 |
| 2015 | $391 | $5,350 | $1,830 | $3,520 |
| 2013 | $391 | $6,170 | $1,830 | $4,340 |
Source: Public Records
Map
Nearby Homes
- 1123 Sequoia Ave
- 2110 Alder Place
- 1280 Sunrise Ln
- TBD W Victory Way 6 66 Acres
- 676 Overlook Dr
- 1903 Frontier Dr
- TBD Finley Ln
- Tbd Sunset Cir
- 3435 Lenox Rd
- TBD Crescent Dr & Riford Rd
- 634 County Road 31
- 198 Cedar Ct
- TBD Hwy 40
- TBD Highway 40
- 2773 W 1st St
- TBD Mack Ln
- TBD S Highway 13 1 32 Acres
- 3821 W 6th St
- 1005 Pershing St
- 3865 W 6th St
- 1110 Sequoia Ave
- 1118 Sequoia Ave
- 1102 Sequoia Ave
- 1097 Aspen Ave
- 1126 Sequoia Ave
- 1105 Aspen Ave
- 1115 Sequoia Ave
- 1076 Sequoia Ave
- 1109 Sequoia Ave
- 1071 Aspen Ave
- 1113 Aspen Ave
- 1134 Sequoia Ave
- 1097 Sequoia Ave
- 1131 Sequoia Ave
- 1139 Sequoia Ave
- 1121 Aspen Ave
- 1126 Cottonwood Ave
- 2275 Willow St
- 1114 Cottonwood Ave
- 1092 Aspen Ave
Your Personal Tour Guide
Ask me questions while you tour the home.