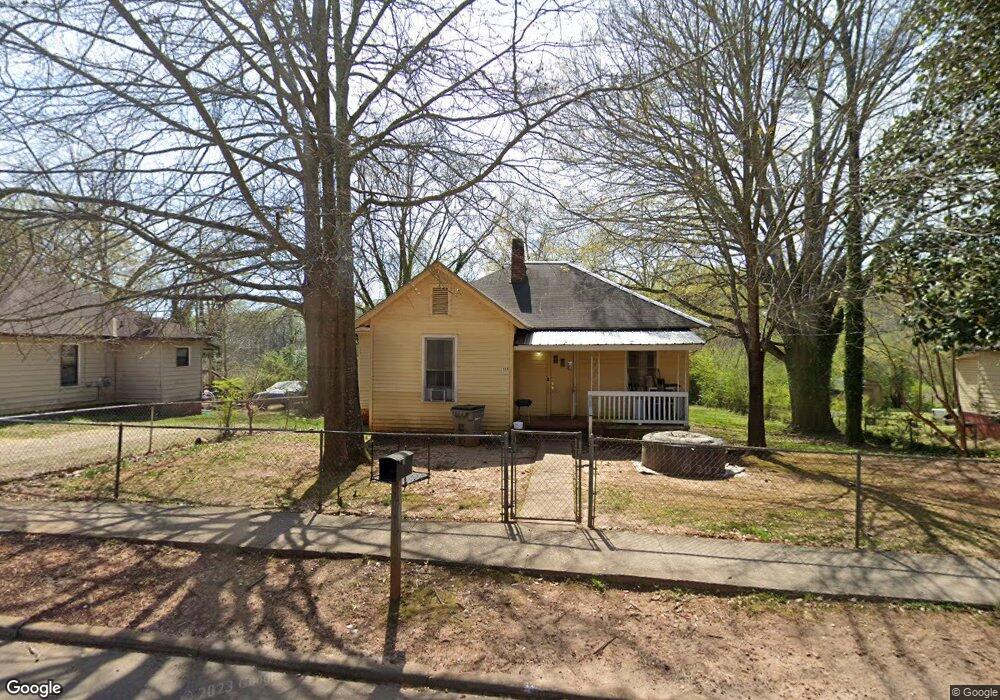
1108 Troup St Lagrange, GA 30240
Estimated Value: $71,000 - $80,000
2
Beds
1
Bath
1,052
Sq Ft
$73/Sq Ft
Est. Value
About This Home
This home is located at 1108 Troup St, Lagrange, GA 30240 and is currently estimated at $77,036, approximately $73 per square foot. 1108 Troup St is a home located in Troup County with nearby schools including Ethel W. Kight Elementary School, Hollis Hand Elementary School, and Franklin Forest Elementary School.
Ownership History
Date
Name
Owned For
Owner Type
Purchase Details
Closed on
Jul 31, 2020
Sold by
K & R Properties Inc
Bought by
Clifton Rentals Inc
Current Estimated Value
Purchase Details
Closed on
Feb 8, 2000
Bought by
K & R Properties
Purchase Details
Closed on
Feb 23, 1998
Sold by
Cofield Cofield and Cofield Clifton
Purchase Details
Closed on
Jul 31, 1997
Sold by
Audrey Holloway
Bought by
Cofield Cofield and Cofield Clifton
Purchase Details
Closed on
Jun 19, 1997
Sold by
Bula Esther Hendrix
Bought by
Audrey Holloway
Purchase Details
Closed on
Jun 20, 1994
Sold by
Deward Wayne Hendrix
Bought by
Bula Esther Hendrix
Purchase Details
Closed on
Jun 16, 1994
Sold by
Audrey Ann Holloway
Bought by
Deward Wayne Hendrix
Purchase Details
Closed on
Aug 12, 1993
Sold by
Hendrix Bula
Bought by
Audrey Ann Holloway
Purchase Details
Closed on
Dec 2, 1982
Sold by
Jerry L Hendricks
Bought by
Hendrix Bula
Purchase Details
Closed on
Apr 9, 1970
Sold by
Lera Langford
Bought by
Jerry L Hendricks
Create a Home Valuation Report for This Property
The Home Valuation Report is an in-depth analysis detailing your home's value as well as a comparison with similar homes in the area
Home Values in the Area
Average Home Value in this Area
Purchase History
| Date | Buyer | Sale Price | Title Company |
|---|---|---|---|
| Clifton Rentals Inc | -- | -- | |
| K & R Properties | -- | -- | |
| -- | -- | -- | |
| Cofield Cofield | $13,200 | -- | |
| Audrey Holloway | -- | -- | |
| Bula Esther Hendrix | -- | -- | |
| Deward Wayne Hendrix | -- | -- | |
| Audrey Ann Holloway | -- | -- | |
| Hendrix Bula | -- | -- | |
| Jerry L Hendricks | -- | -- |
Source: Public Records
Tax History Compared to Growth
Tax History
| Year | Tax Paid | Tax Assessment Tax Assessment Total Assessment is a certain percentage of the fair market value that is determined by local assessors to be the total taxable value of land and additions on the property. | Land | Improvement |
|---|---|---|---|---|
| 2024 | $361 | $13,240 | $3,160 | $10,080 |
| 2023 | $351 | $12,880 | $3,160 | $9,720 |
| 2022 | $343 | $12,280 | $3,160 | $9,120 |
| 2021 | $275 | $9,120 | $3,160 | $5,960 |
| 2020 | $275 | $9,120 | $3,160 | $5,960 |
| 2019 | $224 | $7,440 | $2,120 | $5,320 |
| 2018 | $224 | $7,440 | $2,120 | $5,320 |
| 2017 | $224 | $7,440 | $2,120 | $5,320 |
| 2016 | $234 | $7,742 | $2,022 | $5,720 |
| 2015 | $234 | $7,742 | $2,022 | $5,720 |
| 2014 | $234 | $7,742 | $2,022 | $5,720 |
| 2013 | -- | $10,126 | $2,696 | $7,430 |
Source: Public Records
Map
Nearby Homes
- 119 Jones St
- 205 Grady St
- 1402 Forrest Ave
- The Rhodes Plan at Crown Street Cottages
- The Truitt Plan at Crown Street Cottages
- The Callaway Plan at Crown Street Cottages
- 109 Garfield St
- 102 Crown St Unit LOT 1
- 701 Jefferson St
- 101 Crown St Unit LOT 5
- 612 S Lee St
- 802 Monroe St
- 900 B N Pkwy
- 202 Parker Ln
- 102 Parker St
- 167 S Kight Dr
- 610 Wilburn Ave
- 608 Wilburn Ave
- 1205 Park Ave
- 1311 Juniper St