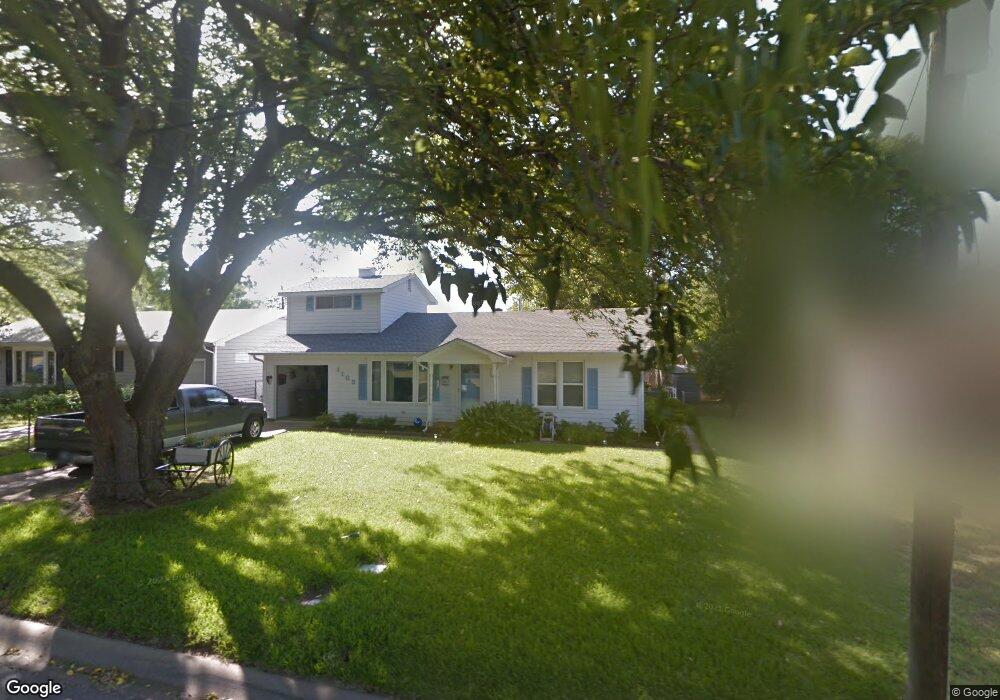
1108 W Lone Star Ave Cleburne, TX 76033
Estimated Value: $225,000 - $251,000
4
Beds
2
Baths
2,115
Sq Ft
$114/Sq Ft
Est. Value
About This Home
This home is located at 1108 W Lone Star Ave, Cleburne, TX 76033 and is currently estimated at $241,927, approximately $114 per square foot. 1108 W Lone Star Ave is a home located in Johnson County with nearby schools including Cooke Elementary School, A.D. Wheat Middle School, and Cleburne High School.
Ownership History
Date
Name
Owned For
Owner Type
Purchase Details
Closed on
Jul 24, 2020
Sold by
Wakeland L W L and Wakeland Lincoin Woodrow
Bought by
Patnode Holli Amity and Famillo Valerie
Current Estimated Value
Home Financials for this Owner
Home Financials are based on the most recent Mortgage that was taken out on this home.
Original Mortgage
$151,525
Outstanding Balance
$107,296
Interest Rate
3.2%
Mortgage Type
New Conventional
Estimated Equity
$134,631
Purchase Details
Closed on
May 12, 2014
Sold by
Wakeland L W
Bought by
Wakeland Ronald Vance and Wakeland Vickie Lynn
Purchase Details
Closed on
Apr 26, 2012
Sold by
Bradley Mary Ellen and Woodall Patsy Nell
Bought by
Nguyen Lam
Purchase Details
Closed on
Apr 13, 2011
Sold by
Veterans Land Board Of The State Of Texa
Bought by
Shaw Arthur Leon
Create a Home Valuation Report for This Property
The Home Valuation Report is an in-depth analysis detailing your home's value as well as a comparison with similar homes in the area
Home Values in the Area
Average Home Value in this Area
Purchase History
| Date | Buyer | Sale Price | Title Company |
|---|---|---|---|
| Patnode Holli Amity | -- | Providence Title Company | |
| Wakeland Ronald Vance | -- | None Available | |
| Nguyen Lam | -- | None Available | |
| Shaw Arthur Leon | $20,000 | None Available |
Source: Public Records
Mortgage History
| Date | Status | Borrower | Loan Amount |
|---|---|---|---|
| Open | Patnode Holli Amity | $151,525 |
Source: Public Records
Tax History Compared to Growth
Tax History
| Year | Tax Paid | Tax Assessment Tax Assessment Total Assessment is a certain percentage of the fair market value that is determined by local assessors to be the total taxable value of land and additions on the property. | Land | Improvement |
|---|---|---|---|---|
| 2025 | $1,036 | $76,397 | $15,000 | $61,397 |
| 2024 | $1,703 | $76,397 | $15,000 | $61,397 |
| 2023 | $1,060 | $152,793 | $30,000 | $122,793 |
| 2022 | $4,920 | $196,604 | $30,500 | $166,104 |
| 2021 | $5,130 | $196,604 | $30,500 | $166,104 |
| 2020 | $2,974 | $159,630 | $22,000 | $137,630 |
| 2019 | $2,883 | $159,630 | $22,000 | $137,630 |
| 2018 | $2,622 | $115,943 | $16,500 | $99,443 |
| 2017 | $2,374 | $81,305 | $16,500 | $64,805 |
| 2016 | $2,158 | $73,305 | $8,500 | $64,805 |
| 2015 | $825 | $73,305 | $8,500 | $64,805 |
| 2014 | $825 | $100,444 | $13,000 | $87,444 |
Source: Public Records
Map
Nearby Homes
- 916 Poindexter Ave
- 807 Poindexter Ave
- 800 Madison St
- 1307 Joslin St
- 107 Woodard Ave
- 1123 Bales St
- 902 Turner St
- 805 Marengo St
- 701 Poindexter Ave
- 808 Marengo St
- 704 Graham St
- 502 Bales St
- 1103 N Walnut St
- 618 Woodard Ave
- 1006 Princeton Place
- 905 Euclid St
- 810 Euclid St
- 1315 Grand Ave
- 104 Dixon St
- 106 Glen Rose Ave
- 1110 W Lone Star Ave
- 1106 W Lone Star Ave
- 1112 W Lone Star Ave
- 1306 N Douglas Ave
- 601 Dixon St
- 1114 W Lone Star Ave
- 605 Dixon St
- 1224 N Douglas Ave
- 1109 W Lone Star Ave
- 1310 N Douglas Ave
- 607 Dixon St
- 1101 W Lone Star Ave
- 1101 W Lone Star Ave Unit A
- 1101 W Lone Star Ave Unit B
- 1222 N Douglas Ave
- 1005 Poindexter Ave
- 1220 N Douglas Ave
- 1012 W Lone Star Ave
- 612 Dixon St
- 1007 Poindexter Ave