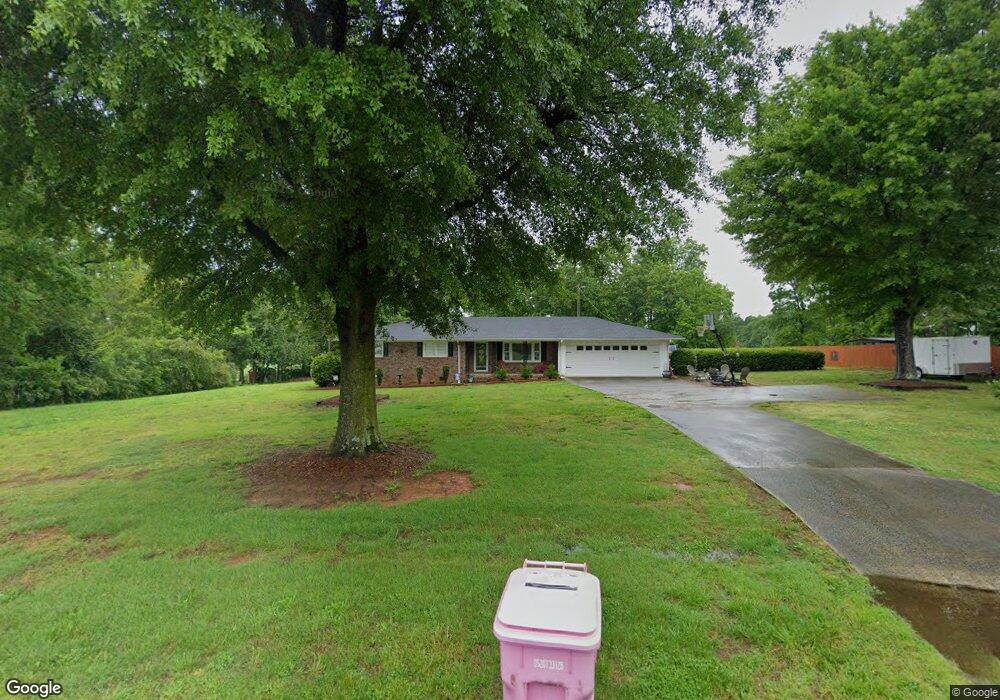
1108 Wildcat Bridge Rd Royston, GA 30662
Estimated Value: $281,000 - $393,000
3
Beds
2
Baths
2,181
Sq Ft
$148/Sq Ft
Est. Value
About This Home
This home is located at 1108 Wildcat Bridge Rd, Royston, GA 30662 and is currently estimated at $323,054, approximately $148 per square foot. 1108 Wildcat Bridge Rd is a home located in Madison County with nearby schools including Madison County High School, Grace Ranch Academy, and Cornerstone Christian Academy.
Ownership History
Date
Name
Owned For
Owner Type
Purchase Details
Closed on
Feb 28, 2020
Sold by
Truitt James B
Bought by
Mccary Jason R and Mccary Marcia P
Current Estimated Value
Home Financials for this Owner
Home Financials are based on the most recent Mortgage that was taken out on this home.
Original Mortgage
$136,000
Outstanding Balance
$120,447
Interest Rate
3.5%
Mortgage Type
New Conventional
Estimated Equity
$202,607
Purchase Details
Closed on
Jan 8, 2013
Sold by
Dockery Lula Mae
Bought by
Brown Cathy D
Purchase Details
Closed on
Jun 25, 2004
Sold by
Lipe Jennifer D
Bought by
Brown Cathy D
Purchase Details
Closed on
Apr 2, 2003
Sold by
Dockery Lula Mae
Bought by
Brown Cathy D and Lipe Jennifer D
Purchase Details
Closed on
Feb 19, 2003
Sold by
Dockery William Howard
Bought by
Dockery Lula Mae
Purchase Details
Closed on
Sep 15, 1998
Sold by
Dockery William H
Bought by
Dockery Lula Mae
Purchase Details
Closed on
Jan 1, 1962
Bought by
Dockery William H
Create a Home Valuation Report for This Property
The Home Valuation Report is an in-depth analysis detailing your home's value as well as a comparison with similar homes in the area
Home Values in the Area
Average Home Value in this Area
Purchase History
| Date | Buyer | Sale Price | Title Company |
|---|---|---|---|
| Mccary Jason R | $170,000 | -- | |
| Brown Cathy D | -- | -- | |
| Brown Cathy D | -- | -- | |
| Brown Cathy D | -- | -- | |
| Dockery Lula Mae | -- | -- | |
| Dockery Lula Mae | -- | -- | |
| Dockery William H | -- | -- |
Source: Public Records
Mortgage History
| Date | Status | Borrower | Loan Amount |
|---|---|---|---|
| Open | Mccary Jason R | $136,000 |
Source: Public Records
Tax History Compared to Growth
Tax History
| Year | Tax Paid | Tax Assessment Tax Assessment Total Assessment is a certain percentage of the fair market value that is determined by local assessors to be the total taxable value of land and additions on the property. | Land | Improvement |
|---|---|---|---|---|
| 2024 | $2,812 | $108,053 | $7,325 | $100,728 |
| 2023 | $3,058 | $100,168 | $6,104 | $94,064 |
| 2022 | $2,403 | $87,108 | $4,196 | $82,912 |
| 2021 | $2,071 | $67,847 | $4,196 | $63,651 |
| 2020 | $1,138 | $37,006 | $3,586 | $33,420 |
| 2019 | $1,128 | $36,272 | $3,586 | $32,686 |
| 2018 | $1,077 | $34,536 | $3,281 | $31,255 |
| 2017 | $1,034 | $35,904 | $3,052 | $32,852 |
| 2016 | $873 | $30,401 | $2,524 | $27,877 |
| 2015 | $873 | $30,401 | $2,524 | $27,877 |
| 2014 | $866 | $29,964 | $2,066 | $27,898 |
| 2013 | -- | $29,964 | $2,066 | $27,898 |
Source: Public Records
Map
Nearby Homes
- 40 Burch St
- 464 Church St
- 0 Wildcat Bridge Rd Unit 23872265
- 0 Wildcat Bridge Rd Unit 10544672
- 2246 Wildcat Bridge Rd
- 121 Cook St
- 0 Tanglewood S Unit 10538272
- 00 S Tanglewood
- 60 Tanglewood N
- 527 Daniel St
- 95 Ext Brad St
- 48 Brad St
- 231 Bowers St
- 240 Bowers St
- 603 Springdale Dr
- 256 Adams Place Rd
- 157 Hartwell St
- 2695 Wildcat Bridge Rd
- 70 Bowers St
- 224 Brad St
- 1146 Wildcat Bridge Rd
- 1037 Wildcat Bridge Rd
- 1040 Wildcat Bridge Rd
- 1366 Wildcat Bridge Rd
- 848 Wildcat Bridge Rd
- 940 Wildcat Bridge Rd
- 1190 Wildcat Bridge Rd
- 955 Wildcat Bridge Rd
- 170 Windy Hill Rd
- 921 Wildcat Bridge Rd
- 1196 Wildcat Bridge Rd
- 167 Windy Hill Rd
- 0 Windy Hill Rd Unit 8130249
- 0 Windy Hill Rd Unit 8355608
- 844 Wildcat Bridge Rd
- 1420 Wildcat Bridge Rd
- 226 Windy Hill Rd
- 311 Windy Hill Rd
- 817 Wildcat Bridge Rd
- 316 Windy Hill Rd