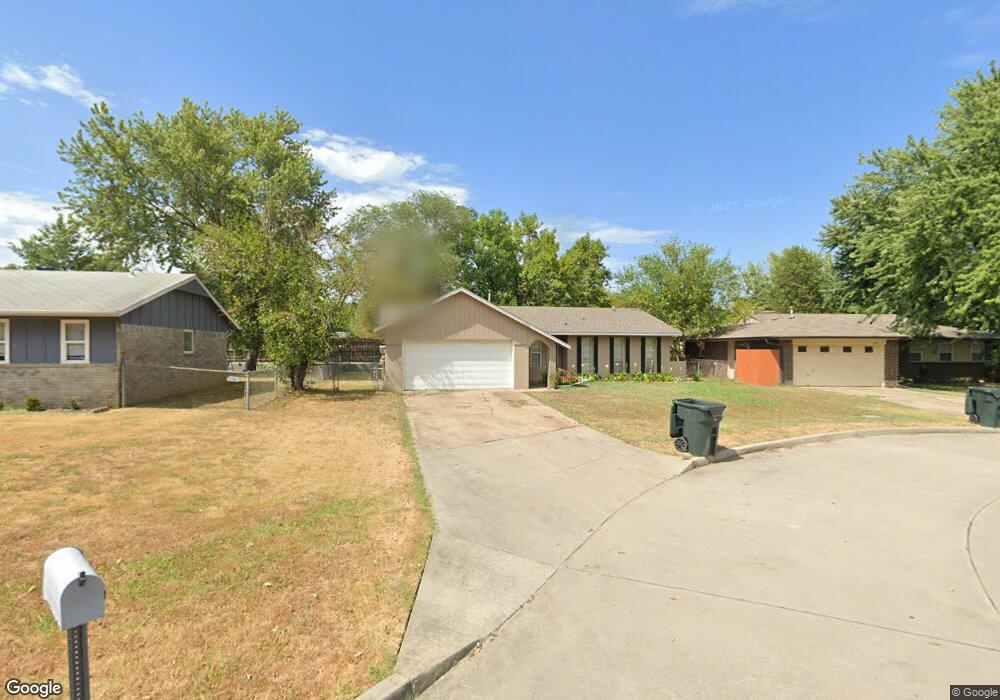
1108 Williams Ct Claremore, OK 74017
Estimated Value: $139,000 - $164,000
3
Beds
2
Baths
1,010
Sq Ft
$148/Sq Ft
Est. Value
About This Home
This home is located at 1108 Williams Ct, Claremore, OK 74017 and is currently estimated at $149,131, approximately $147 per square foot. 1108 Williams Ct is a home located in Rogers County with nearby schools including Westside Elementary School, Will Rogers Junior High School, and Claremore High School.
Ownership History
Date
Name
Owned For
Owner Type
Purchase Details
Closed on
Oct 23, 2020
Sold by
Mckinney Robert M and Robertson Christine M
Bought by
Gross Bradi Lee and Gross James Austin
Current Estimated Value
Home Financials for this Owner
Home Financials are based on the most recent Mortgage that was taken out on this home.
Original Mortgage
$72,000
Outstanding Balance
$63,923
Interest Rate
2.8%
Mortgage Type
New Conventional
Estimated Equity
$85,208
Purchase Details
Closed on
May 22, 2009
Sold by
Lamason Witson and Lamason Nency Lee
Bought by
Mekinney Robert M and Robertson Christine M
Home Financials for this Owner
Home Financials are based on the most recent Mortgage that was taken out on this home.
Original Mortgage
$57,375
Interest Rate
4.7%
Mortgage Type
Purchase Money Mortgage
Purchase Details
Closed on
May 15, 1998
Sold by
Lawson Jerry E
Purchase Details
Closed on
Jan 23, 1998
Sold by
Pearson Frances S and Frances Elizab
Create a Home Valuation Report for This Property
The Home Valuation Report is an in-depth analysis detailing your home's value as well as a comparison with similar homes in the area
Home Values in the Area
Average Home Value in this Area
Purchase History
| Date | Buyer | Sale Price | Title Company |
|---|---|---|---|
| Gross Bradi Lee | $90,000 | Firsttitle & Abstract Svcs L | |
| Mekinney Robert M | $67,500 | Land Title Closing Services | |
| -- | $58,500 | -- | |
| -- | $12,800 | -- |
Source: Public Records
Mortgage History
| Date | Status | Borrower | Loan Amount |
|---|---|---|---|
| Open | Gross Bradi Lee | $72,000 | |
| Previous Owner | Mekinney Robert M | $57,375 |
Source: Public Records
Tax History Compared to Growth
Tax History
| Year | Tax Paid | Tax Assessment Tax Assessment Total Assessment is a certain percentage of the fair market value that is determined by local assessors to be the total taxable value of land and additions on the property. | Land | Improvement |
|---|---|---|---|---|
| 2025 | $936 | $10,127 | $2,691 | $7,436 |
| 2024 | $923 | $9,992 | $1,980 | $8,012 |
| 2023 | $923 | $10,238 | $1,980 | $8,258 |
| 2022 | $962 | $10,395 | $1,980 | $8,415 |
| 2021 | $932 | $10,560 | $1,980 | $8,580 |
| 2020 | $817 | $8,925 | $1,980 | $6,945 |
| 2019 | $810 | $8,743 | $1,980 | $6,763 |
| 2018 | $841 | $9,101 | $1,980 | $7,121 |
| 2017 | $829 | $9,032 | $1,980 | $7,052 |
| 2016 | $828 | $8,824 | $1,980 | $6,844 |
| 2015 | $796 | $8,579 | $1,980 | $6,599 |
| 2014 | $801 | $8,642 | $1,980 | $6,662 |
Source: Public Records
Map
Nearby Homes
- 208 N Chambers Trail
- 1606 N Chambers Terrace
- 902 W 8th St
- 205 N Kates Ave
- 1103 W 20th St
- 1206 W Haskell St
- 1908 N Chambers Terrace
- 0 N J M Davis Blvd
- 1112 W 20th St
- 1907 N Chambers Ave
- 1520 Greenleaf St
- 119 N Missouri Ave
- 1906 Memorial Dr
- 1230 W Dupont St
- 1012 W 22nd St
- 1005 W 23rd St
- 825 W 23rd St N
- 401 W Blue Starr Dr
- 2925 E Holly Rd
- 817 W 24th St N
- 1112 Williams Ct
- 1104 Williams Ct
- 1116 Williams Ct
- 1100 Williams Ct
- 1113 Williams Ct
- 1109 Williams Ct
- 1120 Williams Ct
- 1101 Williams Ct
- 1105 Williams Ct
- 1117 Williams Ct
- 1121 Williams Ct
- 1122 Williams Ct
- 1108 W School Ct
- 1125 Williams Ct
- 1114 W School Ct
- 1104 W School Ct
- 1116 W School Ct
- 1120 W School Ct
- 1101 W 14th Place
- 1402 N Chambers Terrace