Estimated Value: $286,000 - $306,536
2
Beds
2
Baths
1,078
Sq Ft
$276/Sq Ft
Est. Value
About This Home
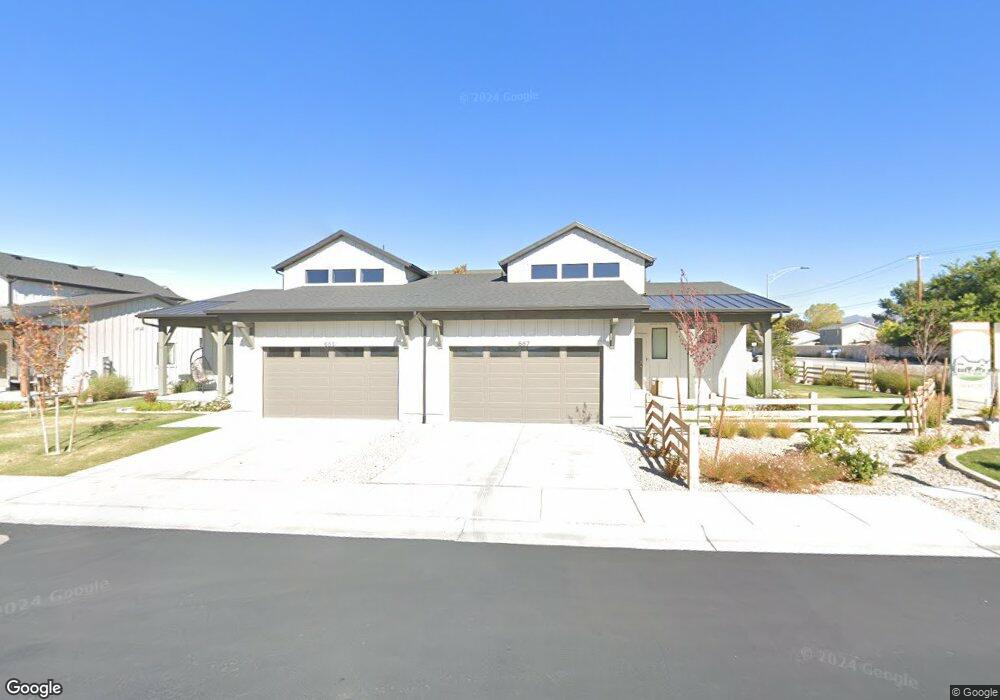
This home is located at 11085 Grape Arbor Place Unit 103, Sandy, UT 84070 and is currently estimated at $297,134, approximately $275 per square foot. 11085 Grape Arbor Place Unit 103 is a home located in Salt Lake County with nearby schools including Altara Elementary School, Challenger School - Sandy, and St. John the Baptist Catholic Middle School.
Ownership History
Date
Name
Owned For
Owner Type
Purchase Details
Closed on
Apr 23, 2014
Sold by
Cosmano Sandra
Bought by
Crescent Senior Living Llc
Current Estimated Value
Purchase Details
Closed on
Sep 8, 2008
Sold by
Green Mark L
Bought by
Cosmano Sandra
Home Financials for this Owner
Home Financials are based on the most recent Mortgage that was taken out on this home.
Original Mortgage
$239,110
Interest Rate
6.59%
Mortgage Type
Seller Take Back
Purchase Details
Closed on
Apr 24, 2008
Sold by
Loveridge Richard G and Loveridge Larae S
Bought by
Green Mark L
Purchase Details
Closed on
May 8, 2007
Sold by
Crescent Heights Llc
Bought by
Loveridge Richard G and Loveridge Larae S
Home Financials for this Owner
Home Financials are based on the most recent Mortgage that was taken out on this home.
Original Mortgage
$185,750
Interest Rate
6.15%
Mortgage Type
Seller Take Back
Create a Home Valuation Report for This Property
The Home Valuation Report is an in-depth analysis detailing your home's value as well as a comparison with similar homes in the area
Home Values in the Area
Average Home Value in this Area
Purchase History
| Date | Buyer | Sale Price | Title Company |
|---|---|---|---|
| Crescent Senior Living Llc | -- | Sutherland Ttle | |
| Cosmano Sandra | -- | Highland Title Agency | |
| Green Mark L | -- | Highland Title Agency | |
| Loveridge Richard G | -- | Talon Group |
Source: Public Records
Mortgage History
| Date | Status | Borrower | Loan Amount |
|---|---|---|---|
| Previous Owner | Cosmano Sandra | $239,110 | |
| Previous Owner | Loveridge Richard G | $185,750 |
Source: Public Records
Tax History Compared to Growth
Tax History
| Year | Tax Paid | Tax Assessment Tax Assessment Total Assessment is a certain percentage of the fair market value that is determined by local assessors to be the total taxable value of land and additions on the property. | Land | Improvement |
|---|---|---|---|---|
| 2025 | $1,485 | $319,100 | $95,700 | $223,400 |
| 2024 | $1,485 | $280,100 | $84,000 | $196,100 |
| 2023 | $1,419 | $267,400 | $80,200 | $187,200 |
| 2022 | $1,525 | $281,000 | $84,300 | $196,700 |
| 2021 | $608 | $231,800 | $69,500 | $162,300 |
| 2020 | $590 | $239,400 | $71,800 | $167,600 |
| 2019 | $449 | $224,700 | $67,400 | $157,300 |
| 2018 | $103 | $224,300 | $67,300 | $157,000 |
| 2017 | $98 | $206,400 | $61,900 | $144,500 |
| 2016 | $144 | $218,800 | $65,600 | $153,200 |
| 2015 | $160 | $208,300 | $62,400 | $145,900 |
| 2014 | $169 | $206,200 | $61,800 | $144,400 |
Source: Public Records
Map
Nearby Homes
- 11085 S Grape Arbor Place Unit 102
- 11075 S Grape Arbor Place Unit 206
- 11035 S Grapevine Cove Unit 204
- 11025 S Grapevine Cove Unit B205
- 11143 Sandy Dunes Dr
- 517 E 11000 S
- 478 E Meadow Hill Dr
- 10973 S Avila Dr
- 409 E 11000 S
- 11186 S 1000 E Unit 1
- 275 E Crescent Park Way Unit 158
- 11202 S 1000 E Unit 3
- 11296 Hidden View Dr Unit 239
- 11310 S 265 E Unit 217
- 11594 S Tuscan View Ct Unit 8
- 221 E Jordan View Dr
- 244 E Crescent Pkwy S Unit 206
- 262 Hidden View Dr Unit 94
- 10681 S 300 E
- 670 Wyngate Pointe Ln
- 11085 Grape Arbor Place Unit 105
- 11085 Grape Arbor Place Unit 201
- 11085 Grape Arbor Place Unit 205
- 11085 Grape Arbor Place Unit 202
- 11085 Grape Arbor Place Unit 101
- 11085 Grape Arbor Place Unit 204
- 11085 Grape Arbor Place Unit 203
- 11085 Grape Arbor Place Unit 206
- 11085 Grape Arbor Place Unit 106
- 11085 Grape Arbor Place Unit 104
- 11085 Grape Arbor Place Unit 102
- 11085 Grape Arbor Place
- 11085 S Grape Arbor Place Unit 106
- 11085 S Grape Arbor Place Unit 206
- 11085 S Grape Arbor Place Place E Unit 205
- 11085 S Grape Arbor Place Unit 101
- 11085 S Grape Arbor Place Place E Unit 106
- 11085 S Grape Arbor Place Place E Unit 204
- 11085 S Grape Arbor Place Unit 104
- 11085 S Grape Arbor Place Unit 203