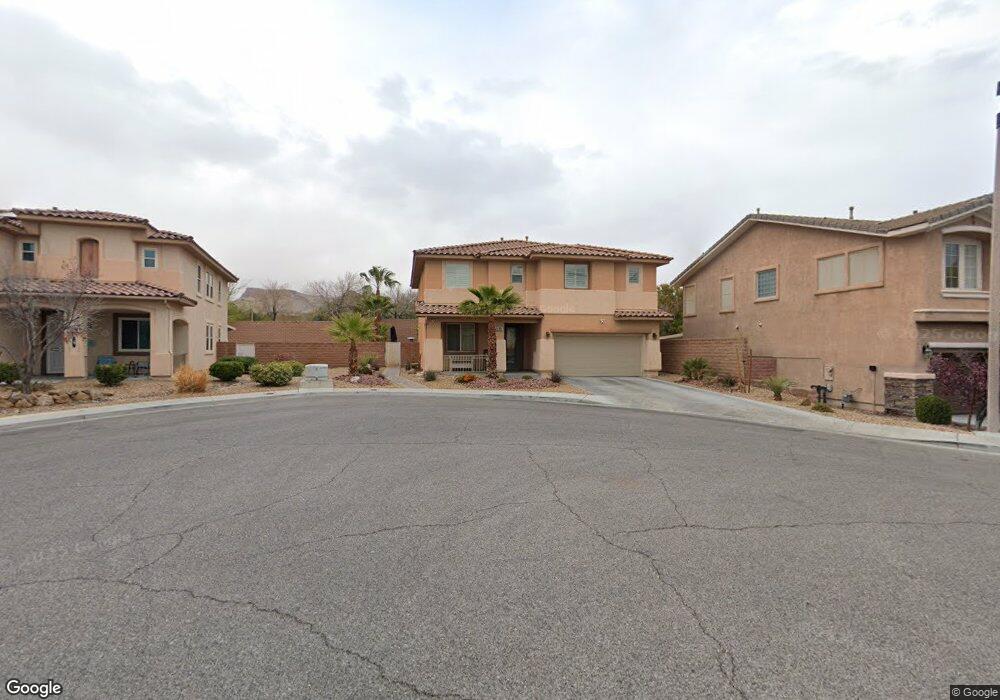
11088 Village Crest Ln Unit 2 Las Vegas, NV 89135
Summerlin NeighborhoodEstimated Value: $632,000 - $806,327
3
Beds
3
Baths
2,672
Sq Ft
$276/Sq Ft
Est. Value
About This Home
This home is located at 11088 Village Crest Ln Unit 2, Las Vegas, NV 89135 and is currently estimated at $738,582, approximately $276 per square foot. 11088 Village Crest Ln Unit 2 is a home located in Clark County with nearby schools including Judy & John L. Goolsby Elementary School, Victoria Fertitta Middle School, and Durango High School.
Ownership History
Date
Name
Owned For
Owner Type
Purchase Details
Closed on
Sep 16, 2015
Sold by
Bishop Blaze and Ancajas Christine
Bought by
The Bishop Family Trust
Current Estimated Value
Purchase Details
Closed on
Oct 24, 2011
Sold by
Bishop Blaze H and Ancajas Christine C
Bought by
Bishop Blaze H and Ancajas Christine C
Purchase Details
Closed on
Feb 13, 2003
Sold by
Kb Home Nevada Inc
Bought by
Bishop Blaze H and Ancajas Christine C
Home Financials for this Owner
Home Financials are based on the most recent Mortgage that was taken out on this home.
Original Mortgage
$260,250
Outstanding Balance
$111,296
Interest Rate
5.93%
Estimated Equity
$627,286
Create a Home Valuation Report for This Property
The Home Valuation Report is an in-depth analysis detailing your home's value as well as a comparison with similar homes in the area
Home Values in the Area
Average Home Value in this Area
Purchase History
| Date | Buyer | Sale Price | Title Company |
|---|---|---|---|
| The Bishop Family Trust | -- | None Available | |
| Bishop Blaze | -- | None Available | |
| Bishop Blaze H | -- | None Available | |
| Bishop Blaze H | $260,215 | First American Title Company |
Source: Public Records
Mortgage History
| Date | Status | Borrower | Loan Amount |
|---|---|---|---|
| Open | Bishop Blaze H | $260,250 |
Source: Public Records
Tax History Compared to Growth
Tax History
| Year | Tax Paid | Tax Assessment Tax Assessment Total Assessment is a certain percentage of the fair market value that is determined by local assessors to be the total taxable value of land and additions on the property. | Land | Improvement |
|---|---|---|---|---|
| 2025 | $4,083 | $185,545 | $67,620 | $117,925 |
| 2024 | $3,964 | $185,545 | $67,620 | $117,925 |
| 2023 | $3,964 | $158,682 | $47,775 | $110,907 |
| 2022 | $4,036 | $140,539 | $38,955 | $101,584 |
| 2021 | $3,737 | $131,281 | $34,913 | $96,368 |
| 2020 | $3,467 | $130,397 | $34,913 | $95,484 |
| 2019 | $3,249 | $125,113 | $31,238 | $93,875 |
| 2018 | $3,100 | $115,873 | $25,725 | $90,148 |
| 2017 | $3,372 | $114,594 | $23,520 | $91,074 |
| 2016 | $2,902 | $109,468 | $19,110 | $90,358 |
| 2015 | $2,896 | $104,236 | $15,803 | $88,433 |
| 2014 | $2,806 | $93,806 | $11,760 | $82,046 |
Source: Public Records
Map
Nearby Homes
- 11 Hawkeye Ln
- 5 Moonfire Dr
- 3744 Fading Sun St
- 20 Garden Rain Dr
- 10922 Moonbeam Glow Ln
- 10982 Village Ridge Ln
- 4140 Coneflower St
- 34 Moonfire Dr
- 15 Gemstar Ln
- 38 Moonfire Dr
- 10 Sugarberry Ln
- 4122 Yucca Bloom St
- 4126 Yucca Bloom St
- 4174 Salisto St
- 11280 Granite Ridge Dr Unit 1075
- 11280 Granite Ridge Dr Unit 1056
- 11280 Granite Ridge Dr Unit 1057
- 11280 Granite Ridge Dr Unit 1012
- 10879 Artesano Ave
- 39 Cranberry Cove Ct
- 11078 Village Crest Ln
- 11098 Village Crest Ln
- 3847 Cinnamon Crest Place Unit 2
- 3835 Cinnamon Crest Place Unit 2
- 3861 Cinnamon Crest Place
- 3821 Cinnamon Crest Place Unit 2
- 11087 Village Crest Ln
- 11077 Village Crest Ln
- 11067 Village Crest Ln
- 3807 Cinnamon Crest Place Unit 2
- 11057 Village Crest Ln
- 3846 Cinnamon Crest Place Unit 2
- 3834 Cinnamon Crest Place
- 3860 Cinnamon Crest Place
- 3820 Cinnamon Crest Place Unit 2
- 3806 Cinnamon Crest Place
- 11037 Village Crest Ln
- 11088 Crown Crest Ln