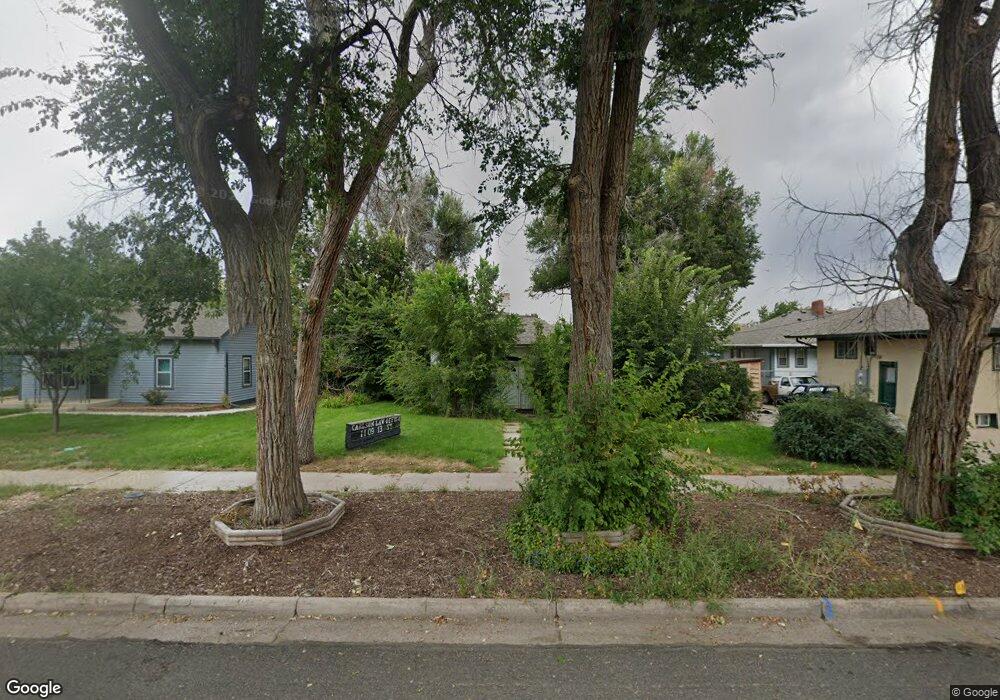
1109 13th St Greeley, CO 80631
Cranford NeighborhoodEstimated Value: $2,151,000
2
Beds
2
Baths
1,982
Sq Ft
$1,085/Sq Ft
Est. Value
About This Home
This home is located at 1109 13th St, Greeley, CO 80631 and is currently priced at $2,151,000, approximately $1,085 per square foot. 1109 13th St is a home located in Weld County with nearby schools including Maplewood Elementary School, Heath Middle School, and Greeley Central High School.
Ownership History
Date
Name
Owned For
Owner Type
Purchase Details
Closed on
May 27, 2004
Sold by
Francis Steven G
Bought by
Carlson William John Eric
Current Estimated Value
Home Financials for this Owner
Home Financials are based on the most recent Mortgage that was taken out on this home.
Original Mortgage
$144,845
Outstanding Balance
$68,827
Interest Rate
6.02%
Mortgage Type
Commercial
Purchase Details
Closed on
Oct 20, 1978
Create a Home Valuation Report for This Property
The Home Valuation Report is an in-depth analysis detailing your home's value as well as a comparison with similar homes in the area
Home Values in the Area
Average Home Value in this Area
Purchase History
| Date | Buyer | Sale Price | Title Company |
|---|---|---|---|
| Carlson William John Eric | $190,000 | Land Title Guarantee Company | |
| -- | -- | -- |
Source: Public Records
Mortgage History
| Date | Status | Borrower | Loan Amount |
|---|---|---|---|
| Open | Carlson William John Eric | $144,845 |
Source: Public Records
Tax History
| Year | Tax Paid | Tax Assessment Tax Assessment Total Assessment is a certain percentage of the fair market value that is determined by local assessors to be the total taxable value of land and additions on the property. | Land | Improvement |
|---|---|---|---|---|
| 2025 | $6,553 | $84,780 | $10,370 | $74,410 |
| 2024 | $6,553 | $84,780 | $10,370 | $74,410 |
| 2023 | $6,249 | $89,560 | $10,820 | $78,740 |
| 2022 | $6,433 | $73,770 | $8,170 | $65,600 |
| 2021 | $6,513 | $74,480 | $8,230 | $66,250 |
| 2020 | $5,137 | $58,930 | $6,780 | $52,150 |
| 2019 | $5,150 | $58,930 | $6,780 | $52,150 |
| 2018 | $3,548 | $42,840 | $6,140 | $36,700 |
| 2017 | $3,568 | $42,840 | $6,140 | $36,700 |
| 2016 | $2,689 | $36,350 | $5,050 | $31,300 |
| 2015 | $2,679 | $36,350 | $5,050 | $31,300 |
| 2014 | $1,568 | $20,750 | $3,890 | $16,860 |
Source: Public Records
Map
Nearby Homes
Your Personal Tour Guide
Ask me questions while you tour the home.