
Landlord's Agent in 2025
Brenna Sutton
McEnearney Associates
(571) 491-5209
3 Total Sales
Estimated Value: $326,000 - $353,000
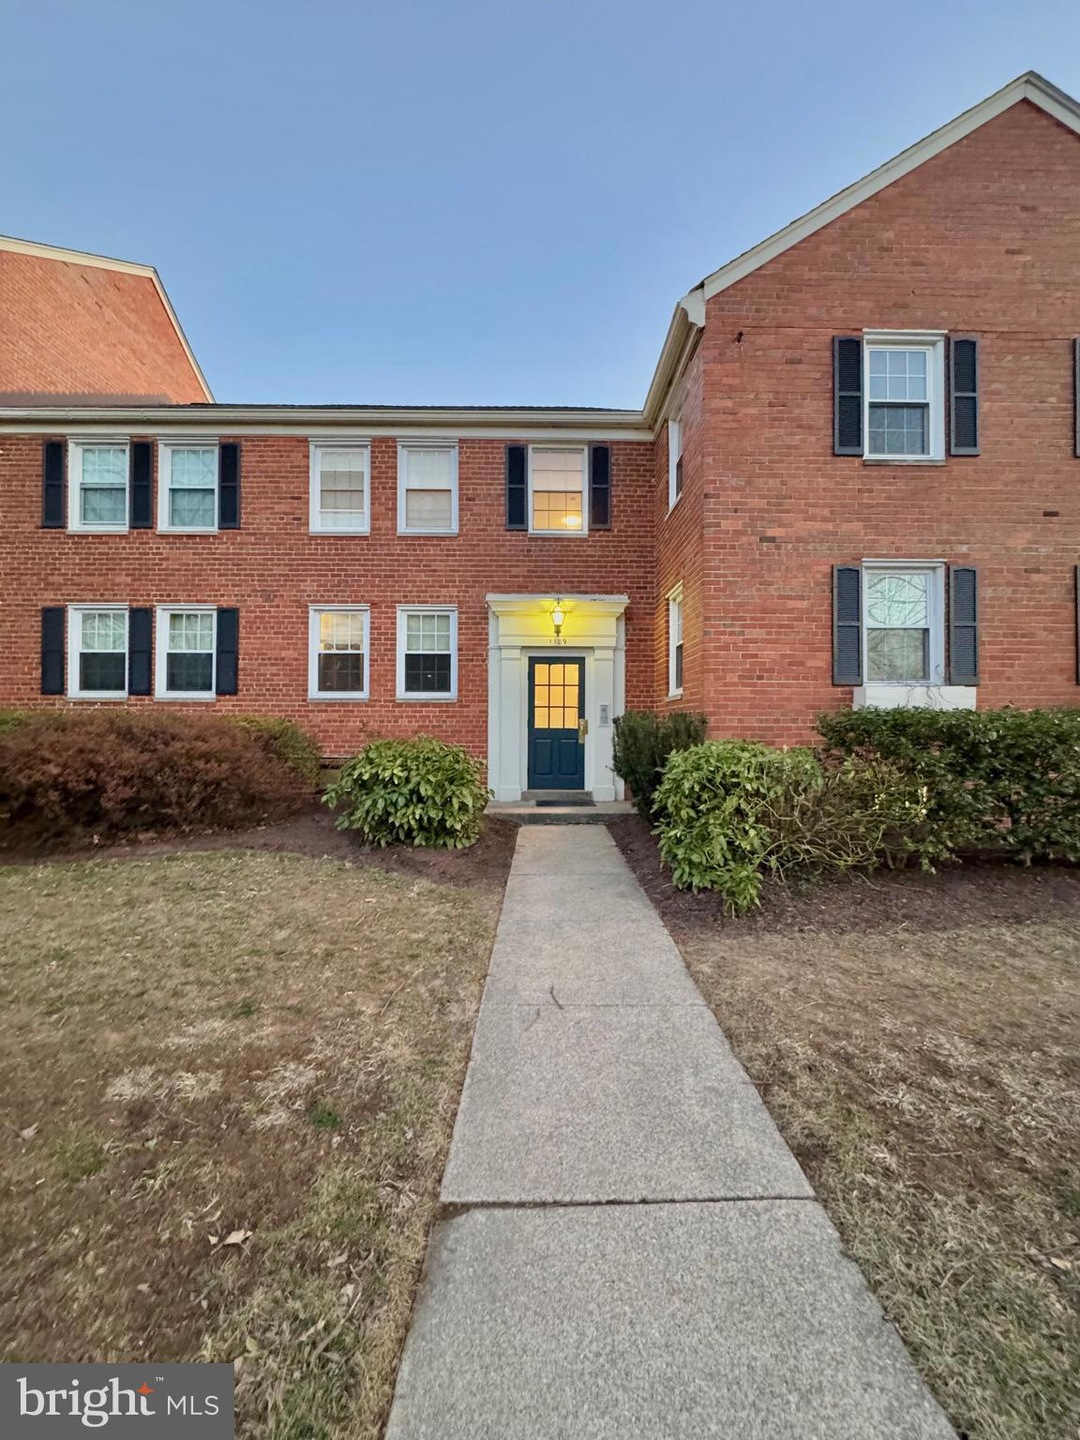
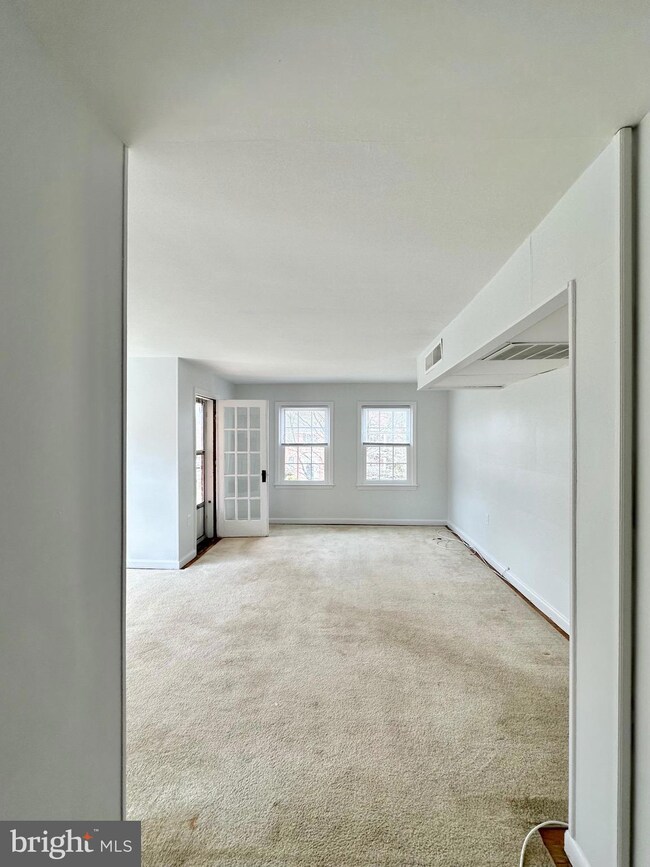
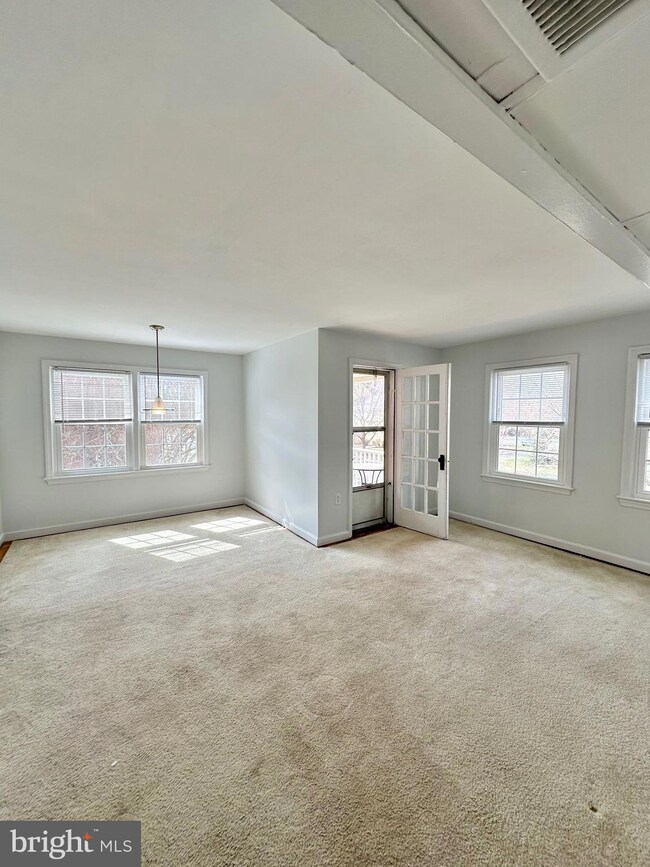
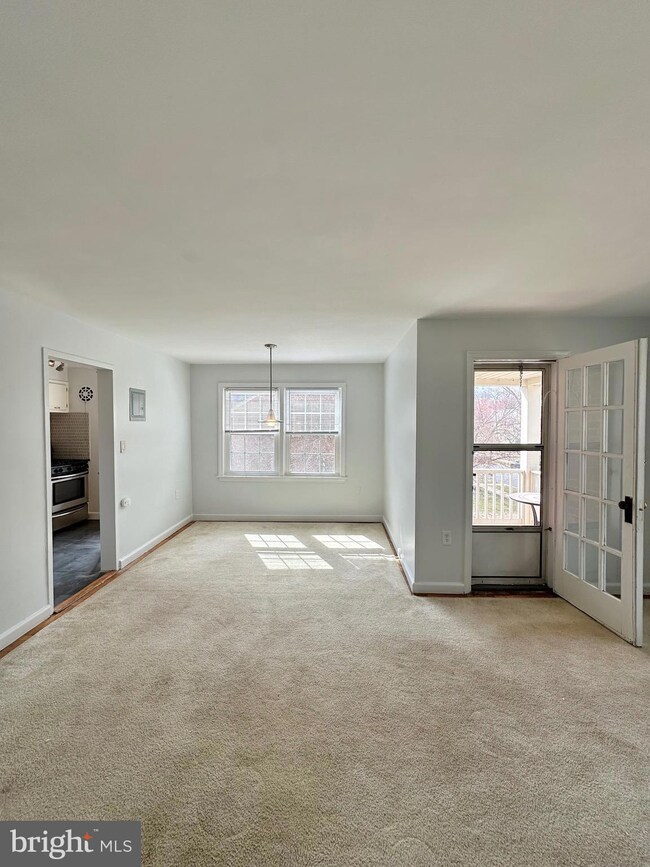
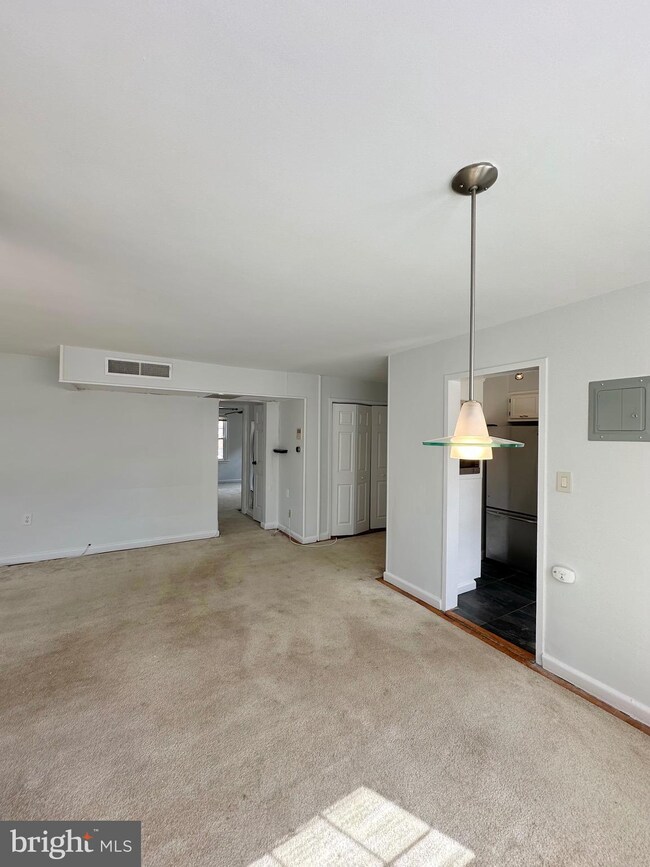
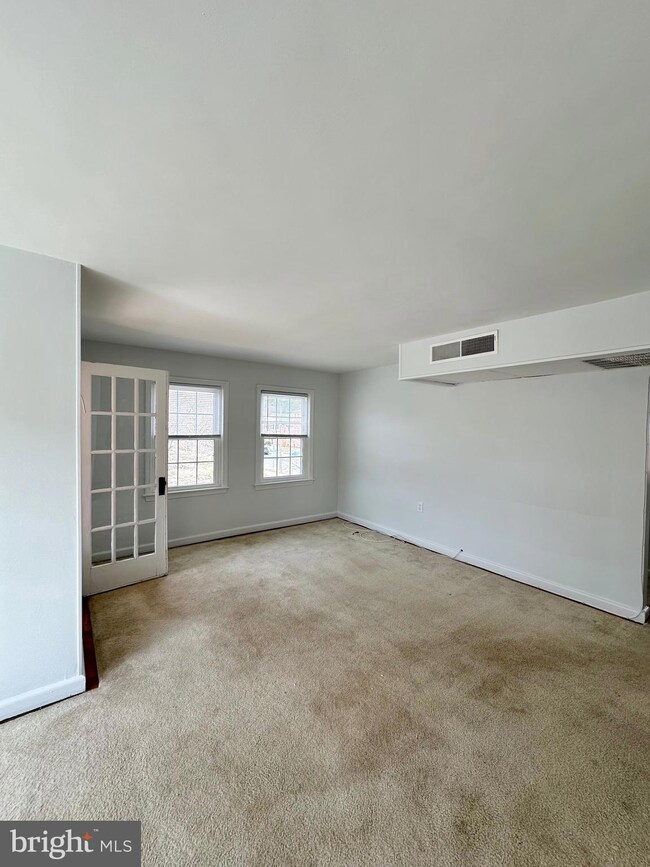
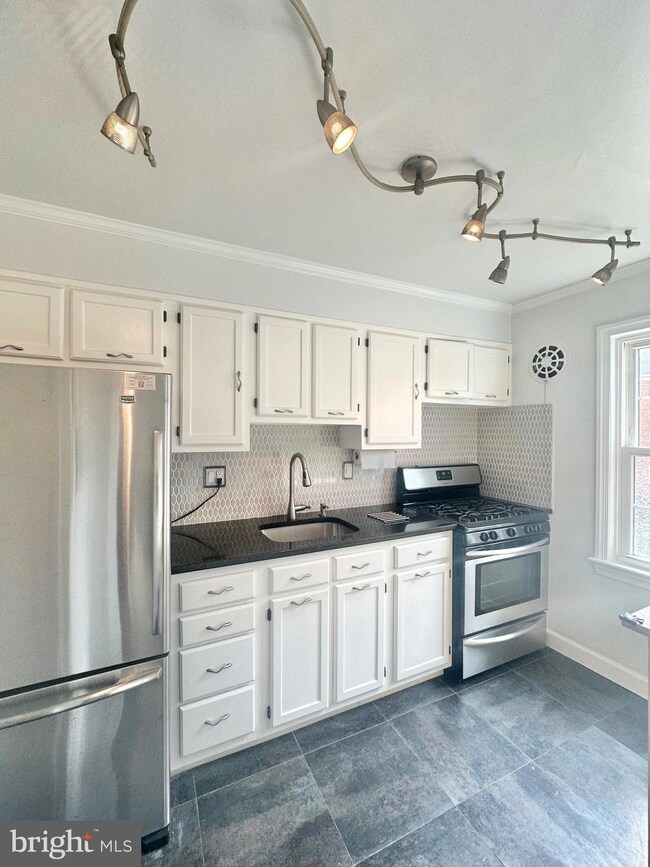
Welcome to 1109 Belleview Blvd, Unit B2 in Alexandria VA. Lovely 2 bedroom/1 bathroom condominium located in the Belleview subdivision. Unit boasts wall to wall carpet, kitchen with stainless steel appliances and updated counter tops as well as an updated full bathroom. Unit is convenient to shopping, dining, GW Parkway, 495 and Old Town Alexandria. On street parking.
Last Agent to Rent the Property
(571) 491-5209 bsutton@mcenearney.com Corcoran McEnearney License #0225258470 Listed on: 03/04/2025
Last Renter's Agent
datacorrect@brightmls.com Non Subscribing Office License #0225194075
| Date | Buyer | Sale Price | Title Company |
|---|---|---|---|
| Plummer Craig A | $250,000 | -- |
| Date | Status | Borrower | Loan Amount |
|---|---|---|---|
| Open | Plummer Craig A | $235,175 |
| Date | Event | Price | List to Sale | Price per Sq Ft |
|---|---|---|---|---|
| 03/18/2025 03/18/25 | Rented | $2,200 | 0.0% | -- |
| 03/14/2025 03/14/25 | Under Contract | -- | -- | -- |
| 03/04/2025 03/04/25 | For Rent | $2,200 | +18.9% | -- |
| 04/29/2022 04/29/22 | Rented | $1,850 | 0.0% | -- |
| 04/27/2022 04/27/22 | Under Contract | -- | -- | -- |
| 04/22/2022 04/22/22 | For Rent | $1,850 | +2.8% | -- |
| 03/22/2022 03/22/22 | Rented | $1,800 | 0.0% | -- |
| 03/17/2022 03/17/22 | Under Contract | -- | -- | -- |
| 03/05/2022 03/05/22 | For Rent | $1,800 | +9.1% | -- |
| 05/25/2018 05/25/18 | Rented | $1,650 | -5.7% | -- |
| 05/22/2018 05/22/18 | Under Contract | -- | -- | -- |
| 05/02/2018 05/02/18 | For Rent | $1,750 | 0.0% | -- |
| 10/28/2016 10/28/16 | Rented | $1,750 | 0.0% | -- |
| 10/26/2016 10/26/16 | Under Contract | -- | -- | -- |
| 10/07/2016 10/07/16 | For Rent | $1,750 | -- | -- |
| Year | Tax Paid | Tax Assessment Tax Assessment Total Assessment is a certain percentage of the fair market value that is determined by local assessors to be the total taxable value of land and additions on the property. | Land | Improvement |
|---|---|---|---|---|
| 2025 | $3,336 | $311,000 | $62,000 | $249,000 |
| 2024 | $3,336 | $287,960 | $58,000 | $229,960 |
| 2023 | $3,155 | $279,570 | $56,000 | $223,570 |
| 2022 | $3,365 | $294,280 | $59,000 | $235,280 |
| 2021 | $3,321 | $282,960 | $57,000 | $225,960 |
| 2020 | $3,159 | $266,940 | $53,000 | $213,940 |
| 2019 | $2,849 | $240,740 | $48,000 | $192,740 |
| 2018 | $2,662 | $231,480 | $46,000 | $185,480 |
| 2017 | $2,581 | $222,350 | $44,000 | $178,350 |
| 2016 | $2,651 | $228,840 | $46,000 | $182,840 |
| 2015 | $2,504 | $224,350 | $45,000 | $179,350 |
| 2014 | $2,807 | $252,080 | $50,000 | $202,080 |
Landlord's Agent in 2025
Brenna Sutton
McEnearney Associates
(571) 491-5209
3 Total Sales
d
Tenant's Agent in 2025
datacorrect BrightMLS
Non Subscribing Office
Seller's Agent in 2022
Marshall Ramsey
McEnearney Associates
(703) 626-4164
Seller's Agent in 2022
Meiling Yang
McEnearney Associates
(703) 944-8403
28 Total Sales
Buyer's Agent in 2022
Courtney DeVries
McEnearney Associates
(703) 795-8311
16 Total Sales
R
Buyer's Agent in 2016
Ruth Guirard
Long & Foster
Source: Bright MLS
MLS Number: VAFX2225394
APN: 0932-13-1109B2
Disclaimer: Certain information contained herein is derived from information provided by parties other than Homes.com. All information provided is deemed reliable, but is not guaranteed to be accurate and should be independently verified.
![]() The data relating to real estate for sale on this website appears in part through the BRIGHT Internet Data Exchange program, a voluntary cooperative exchange of property listing data between licensed real estate brokerage firms, and is provided by BRIGHT through a licensing agreement.
The data relating to real estate for sale on this website appears in part through the BRIGHT Internet Data Exchange program, a voluntary cooperative exchange of property listing data between licensed real estate brokerage firms, and is provided by BRIGHT through a licensing agreement.
Listing information is from various brokers who participate in the Bright MLS IDX program and not all listings may be visible on the site.
The property information being provided on or through the website is for the personal, non-commercial use of consumers and such information may not be used for any purpose other than to identify prospective properties consumers may be interested in purchasing.
Some properties which appear for sale on the website may no longer be available because they are for instance, under contract, sold or are no longer being offered for sale.
Property information displayed is deemed reliable but is not guaranteed.
Copyright 2025 Bright MLS, Inc.