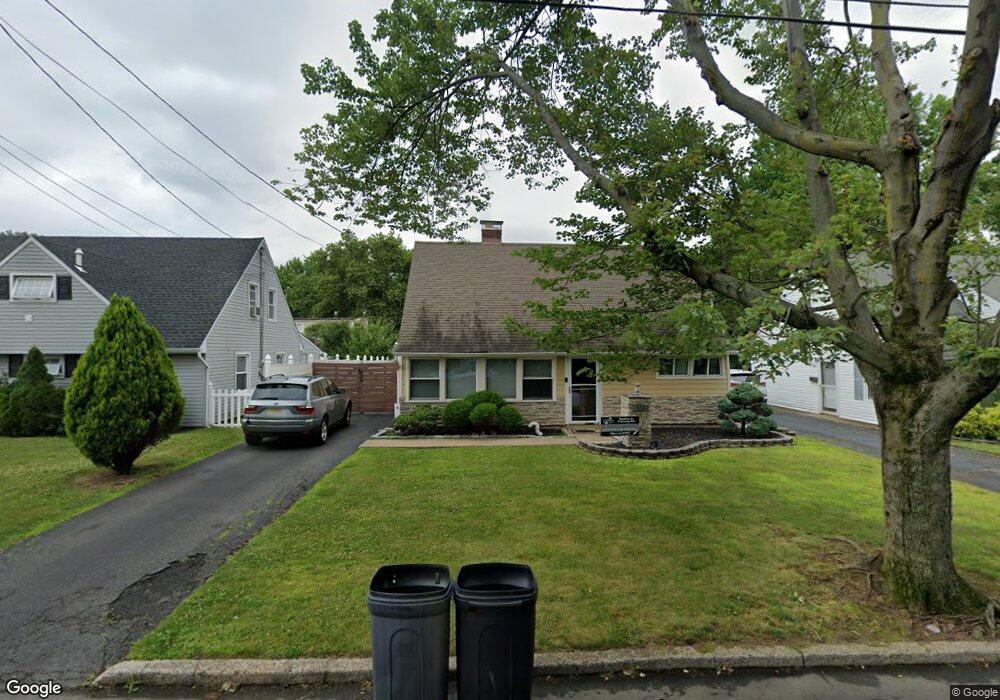
1109 Briarcliff Dr Rahway, NJ 07065
Estimated Value: $443,039 - $550,000
--
Bed
--
Bath
1,331
Sq Ft
$370/Sq Ft
Est. Value
About This Home
This home is located at 1109 Briarcliff Dr, Rahway, NJ 07065 and is currently estimated at $492,010, approximately $369 per square foot. 1109 Briarcliff Dr is a home located in Union County with nearby schools including Rahway High School and Mother Seton Regional High School.
Ownership History
Date
Name
Owned For
Owner Type
Purchase Details
Closed on
Oct 19, 2012
Sold by
Bonisisio Christopher and Bonisisio Brandy A
Bought by
Bonisisio Christopher and Bonisisio Brandy A
Current Estimated Value
Home Financials for this Owner
Home Financials are based on the most recent Mortgage that was taken out on this home.
Original Mortgage
$231,042
Interest Rate
3.75%
Mortgage Type
FHA
Purchase Details
Closed on
Jan 21, 2005
Sold by
Jachim Richard S
Bought by
Bonisisio Christopher and Bonididio Brandy A
Home Financials for this Owner
Home Financials are based on the most recent Mortgage that was taken out on this home.
Original Mortgage
$259,921
Interest Rate
5.71%
Mortgage Type
FHA
Purchase Details
Closed on
Oct 31, 1994
Sold by
Dilollo Frank P and Garibaldi Joseph D
Bought by
Jachim Richard S
Create a Home Valuation Report for This Property
The Home Valuation Report is an in-depth analysis detailing your home's value as well as a comparison with similar homes in the area
Home Values in the Area
Average Home Value in this Area
Purchase History
| Date | Buyer | Sale Price | Title Company |
|---|---|---|---|
| Bonisisio Christopher | -- | None Available | |
| Bonisisio Christopher | -- | -- | |
| Jachim Richard S | $112,000 | -- |
Source: Public Records
Mortgage History
| Date | Status | Borrower | Loan Amount |
|---|---|---|---|
| Previous Owner | Bonisisio Christopher | $231,042 | |
| Previous Owner | Bonisisio Christopher | $259,921 |
Source: Public Records
Tax History Compared to Growth
Tax History
| Year | Tax Paid | Tax Assessment Tax Assessment Total Assessment is a certain percentage of the fair market value that is determined by local assessors to be the total taxable value of land and additions on the property. | Land | Improvement |
|---|---|---|---|---|
| 2025 | $9,782 | $132,100 | $67,500 | $64,600 |
| 2024 | $9,474 | $132,100 | $67,500 | $64,600 |
| 2023 | $9,474 | $132,100 | $67,500 | $64,600 |
| 2022 | $9,276 | $132,100 | $67,500 | $64,600 |
| 2021 | $9,182 | $132,100 | $67,500 | $64,600 |
| 2020 | $9,148 | $132,100 | $67,500 | $64,600 |
| 2019 | $9,032 | $132,100 | $67,500 | $64,600 |
| 2018 | $8,841 | $132,100 | $67,500 | $64,600 |
| 2017 | $8,623 | $132,100 | $67,500 | $64,600 |
| 2016 | $8,440 | $132,100 | $67,500 | $64,600 |
| 2015 | $8,345 | $132,100 | $67,500 | $64,600 |
| 2014 | $8,195 | $132,100 | $67,500 | $64,600 |
Source: Public Records
Map
Nearby Homes
- 1169 Briarcliff Dr
- 1126 Stone St
- 1095 Elm Terrace
- 1081 Madison Hill Rd
- 789 Hillside Rd
- 1218 Kline Place
- 741 Brookside Rd
- 992 Milton Blvd
- 800 Nicholas Place
- 1151 Charlotte Place
- 1166 Jefferson Ave
- 58 Gertrude St
- 1374 Lambert St
- 1062 Westfield Ave
- 22 Washington St
- 770 Stone St
- 706 W Milton Ave
- 1489 Jefferson Ave
- 593 W Hazelwood Ave
- 723 Dianne Ct
- 1119 Briarcliff Dr
- 1101 Briarcliff Dr
- 1129 Briarcliff Dr
- 1091 Briarcliff Dr
- 1118 Mayfair Dr
- 1108 Mayfair Dr
- 1128 Mayfair Dr
- 1118 Briarcliff Dr
- 1081 Briarcliff Dr
- 1139 Briarcliff Dr
- 1098 Mayfair Dr
- 1096 Briarcliff Dr
- 1138 Mayfair Dr
- 1088 Mayfair Dr
- 1071 Briarcliff Dr
- 1149 Briarcliff Dr
- 1084 Briarcliff Dr
- 1078 Mayfair Dr
- 1158 Mayfair Dr
- 1074 Briarcliff Dr