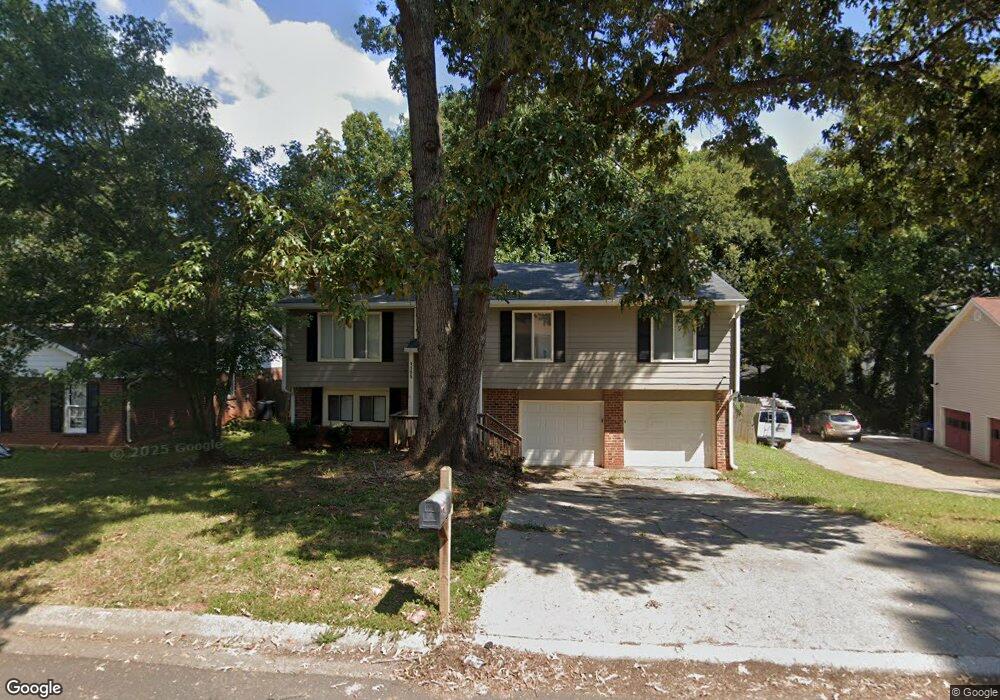
1109 Brittney Way Unit 2 Norcross, GA 30093
Estimated Value: $323,000 - $364,000
3
Beds
2
Baths
1,535
Sq Ft
$228/Sq Ft
Est. Value
About This Home
This home is located at 1109 Brittney Way Unit 2, Norcross, GA 30093 and is currently estimated at $349,458, approximately $227 per square foot. 1109 Brittney Way Unit 2 is a home located in Gwinnett County with nearby schools including Minor Elementary School, Berkmar Middle School, and Berkmar High School.
Ownership History
Date
Name
Owned For
Owner Type
Purchase Details
Closed on
Oct 24, 2017
Sold by
Tah 2015 1 Borrower Llc
Bought by
Tah Ms Borrower Llc
Current Estimated Value
Purchase Details
Closed on
Sep 2, 2014
Sold by
Acosta Aieredo
Bought by
Castle Atlanta Holding Lp
Purchase Details
Closed on
Feb 5, 2004
Sold by
Secretary Of Hud
Bought by
Vega Melanio
Purchase Details
Closed on
Oct 7, 2003
Sold by
Mers
Bought by
Hud
Purchase Details
Closed on
Apr 25, 2001
Sold by
Hussien Mohammed
Bought by
Hussien Mohammed
Home Financials for this Owner
Home Financials are based on the most recent Mortgage that was taken out on this home.
Original Mortgage
$115,101
Interest Rate
6.95%
Mortgage Type
New Conventional
Purchase Details
Closed on
Aug 10, 1999
Sold by
Omer Sebri and Omer Ashut E
Bought by
Hussien Mohamed
Home Financials for this Owner
Home Financials are based on the most recent Mortgage that was taken out on this home.
Original Mortgage
$109,944
Interest Rate
7.65%
Mortgage Type
FHA
Create a Home Valuation Report for This Property
The Home Valuation Report is an in-depth analysis detailing your home's value as well as a comparison with similar homes in the area
Home Values in the Area
Average Home Value in this Area
Purchase History
| Date | Buyer | Sale Price | Title Company |
|---|---|---|---|
| Tah Ms Borrower Llc | -- | -- | |
| Castle Atlanta Holding Lp | $62,000 | -- | |
| Vega Melanio | -- | -- | |
| Hud | -- | -- | |
| Mers | $125,508 | -- | |
| Hussien Mohammed | -- | -- | |
| Hussien Mohamed | $110,000 | -- |
Source: Public Records
Mortgage History
| Date | Status | Borrower | Loan Amount |
|---|---|---|---|
| Previous Owner | Hussien Mohammed | $115,101 | |
| Previous Owner | Hussien Mohamed | $109,944 |
Source: Public Records
Tax History Compared to Growth
Tax History
| Year | Tax Paid | Tax Assessment Tax Assessment Total Assessment is a certain percentage of the fair market value that is determined by local assessors to be the total taxable value of land and additions on the property. | Land | Improvement |
|---|---|---|---|---|
| 2024 | $5,048 | $132,240 | $24,000 | $108,240 |
| 2023 | $5,048 | $136,360 | $24,000 | $112,360 |
| 2022 | $3,227 | $81,800 | $13,200 | $68,600 |
| 2021 | $3,263 | $81,800 | $13,200 | $68,600 |
| 2020 | $3,280 | $81,800 | $13,200 | $68,600 |
| 2019 | $3,122 | $81,800 | $13,200 | $68,600 |
| 2018 | $2,715 | $70,160 | $10,880 | $59,280 |
| 2016 | $1,691 | $40,440 | $9,600 | $30,840 |
| 2015 | $1,496 | $34,374 | $5,780 | $28,594 |
| 2014 | -- | $40,440 | $6,800 | $33,640 |
Source: Public Records
Map
Nearby Homes
- 1146 Samuel Dr
- 1151 Overland Hill Trace
- 4059 Heritage Valley Ct
- 4017 Heritage Valley Ct
- 1331 Sweet Pine Dr
- 4139 Magnolia Glen Walk
- 918 Hampton Trail NW
- 1052 Rabun Dr NW Unit 2
- 3826 Green Bay Dr Unit 2
- 881 Huntington Way NW
- 4092 Anvil Ct Unit 2
- 3955 Peninsula Ct
- 1432 Shenta Oak Dr
- 4446 Arcadia Dr
- 4453 Freeman Ct Unit 1
- 4450 Bradstone Trace NW Unit 2
- 3726 Green Bay Dr Unit 1
- 3951 Millwood Ln NW
- 3975 Creek Water Ct Unit 1
- 3871 Pleasant Oaks Dr Unit 59
- 1109 Brittney Way
- 1099 Brittney Way
- 0 Brittney Way Unit 7294895
- 0 Brittney Way Unit 9062336
- 0 Brittney Way Unit 8796549
- 0 Brittney Way Unit 8810854
- 0 Brittney Way Unit 8904784
- 0 Brittney Way Unit 3145965
- 0 Brittney Way
- 1010 Heritage Valley Rd
- 1000 Heritage Valley Rd
- 1020 Heritage Valley Rd
- 1129 Brittney Way Unit 2
- 1089 Brittney Way Unit 2
- 1030 Heritage Valley Rd
- 1118 Brittney Way
- 990 Heritage Valley Rd
- 1128 Brittney Way
- 990 Buckley Place
- 1098 Brittney Way