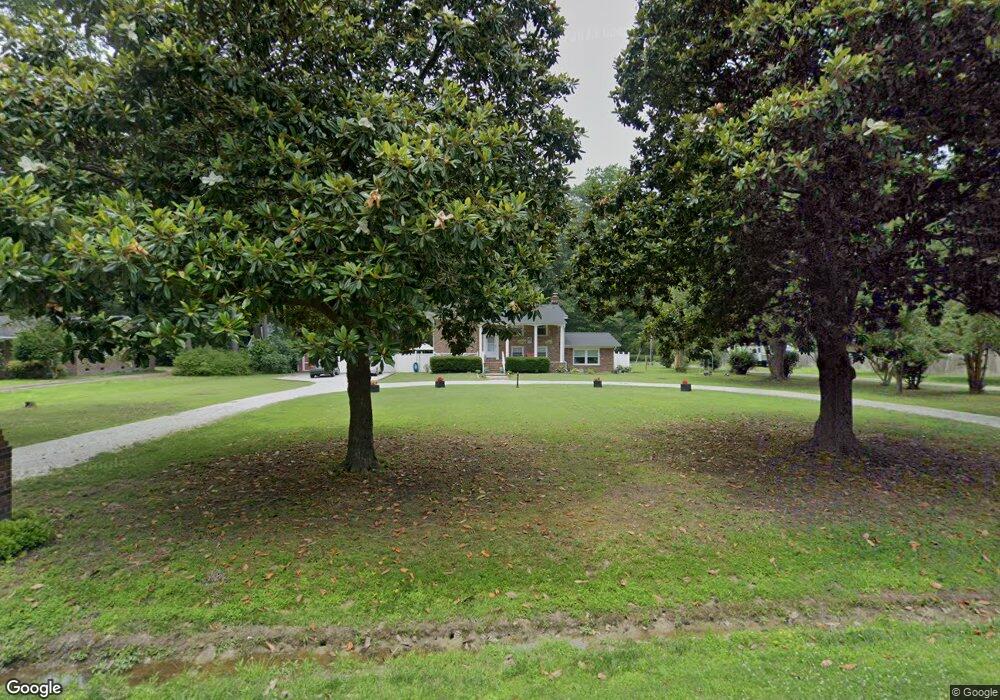
1109 Calthrop Neck Rd Yorktown, VA 23693
Tabb NeighborhoodEstimated Value: $480,000 - $522,000
4
Beds
3
Baths
2,650
Sq Ft
$190/Sq Ft
Est. Value
About This Home
This home is located at 1109 Calthrop Neck Rd, Yorktown, VA 23693 and is currently estimated at $502,291, approximately $189 per square foot. 1109 Calthrop Neck Rd is a home located in York County with nearby schools including Mt. Vernon Elementary School, Tabb Middle School, and Tabb High School.
Ownership History
Date
Name
Owned For
Owner Type
Purchase Details
Closed on
May 26, 2020
Sold by
Lawson Randy F and Lawson Amanda E
Bought by
Tetrault James F and Tetrault Lannie N
Current Estimated Value
Home Financials for this Owner
Home Financials are based on the most recent Mortgage that was taken out on this home.
Original Mortgage
$348,614
Outstanding Balance
$309,596
Interest Rate
3.3%
Mortgage Type
VA
Estimated Equity
$192,695
Purchase Details
Closed on
Jan 12, 2017
Sold by
Taylor Mary B
Bought by
Lawson Randy F and Lawson Amanda E
Home Financials for this Owner
Home Financials are based on the most recent Mortgage that was taken out on this home.
Original Mortgage
$289,750
Interest Rate
4.08%
Mortgage Type
New Conventional
Purchase Details
Closed on
Apr 12, 2001
Sold by
Harrison Betty D
Bought by
Deer Charles M
Home Financials for this Owner
Home Financials are based on the most recent Mortgage that was taken out on this home.
Original Mortgage
$162,416
Interest Rate
6.9%
Create a Home Valuation Report for This Property
The Home Valuation Report is an in-depth analysis detailing your home's value as well as a comparison with similar homes in the area
Home Values in the Area
Average Home Value in this Area
Purchase History
| Date | Buyer | Sale Price | Title Company |
|---|---|---|---|
| Tetrault James F | $336,500 | Attorney | |
| Lawson Randy F | $305,000 | Barristers Of Virginia | |
| Deer Charles M | $163,700 | -- |
Source: Public Records
Mortgage History
| Date | Status | Borrower | Loan Amount |
|---|---|---|---|
| Open | Tetrault James F | $348,614 | |
| Previous Owner | Lawson Randy F | $289,750 | |
| Previous Owner | Deer Charles M | $162,416 |
Source: Public Records
Tax History Compared to Growth
Tax History
| Year | Tax Paid | Tax Assessment Tax Assessment Total Assessment is a certain percentage of the fair market value that is determined by local assessors to be the total taxable value of land and additions on the property. | Land | Improvement |
|---|---|---|---|---|
| 2025 | $2,815 | $380,400 | $142,800 | $237,600 |
| 2024 | $2,815 | $380,400 | $142,800 | $237,600 |
| 2023 | $2,680 | $348,100 | $142,800 | $205,300 |
| 2022 | $2,715 | $348,100 | $142,800 | $205,300 |
| 2021 | $2,449 | $308,000 | $139,000 | $169,000 |
| 2020 | $2,449 | $308,000 | $139,000 | $169,000 |
| 2019 | $3,470 | $304,400 | $139,000 | $165,400 |
| 2018 | $3,470 | $304,400 | $139,000 | $165,400 |
| 2017 | $2,529 | $336,500 | $168,000 | $168,500 |
| 2016 | -- | $336,500 | $168,000 | $168,500 |
| 2015 | -- | $336,500 | $168,000 | $168,500 |
| 2014 | -- | $336,500 | $168,000 | $168,500 |
Source: Public Records
Map
Nearby Homes
- 119 River Point Dr
- 814 Calthrop Neck Rd
- 112 Lambs Creek Dr
- 105 Ocean Breeze Dr
- 106 Ocean Breeze Dr
- 15 Pickins Dr
- 103 Darden Dr
- 9 Cherokee Dr
- 15 Carriage Hill Dr
- 51 Carriage Hill Dr
- 103 Jonadab Rd
- 508 E Woodland Dr
- 639 Yorktown Rd
- 132 Breezy Point Dr
- 706 Yorktown Rd
- 11 Bull Run
- 106 Running Man Trail
- 40 Valmoore Dr
- 107 Goffigans Trace
- 101 Goffigans Trace
- 1101 Calthrop Neck Rd
- 102 Melinda Ln
- 1117 Calthrop Neck Rd
- 106 River Point Dr
- 1017 Calthrop Neck Rd
- 1121 Calthrop Neck Rd
- 1112 Calthrop Neck Rd
- 101 Dryden Ln
- 108 River Point Dr
- 201 Melinda Ln
- 1116 Calthrop Neck Rd
- 103 Dryden Ln
- 1120 Calthrop Neck Rd
- 110 River Point Dr
- 102 Bunting Point Rd
- 1007 Calthrop Neck Rd
- 102 Dryden Ln
- 103 Bunting Point Rd
- 1200 Calthrop Neck Rd
- 104 Dryden Ln