NOT LISTED FOR SALE

1109 Carriage Ln New Albany, IN 47150

Estimated Value: $299,000 - $350,000

3 Beds
3 Baths
1,892 Sq Ft
$167/Sq Ft Est. Value

Last Sold January 31, 2025

Last sale price $298,000 $158 Per Sq Ft

Est. 6% increase in value since last sale

Current estimated payment $1,865/month

About This Home

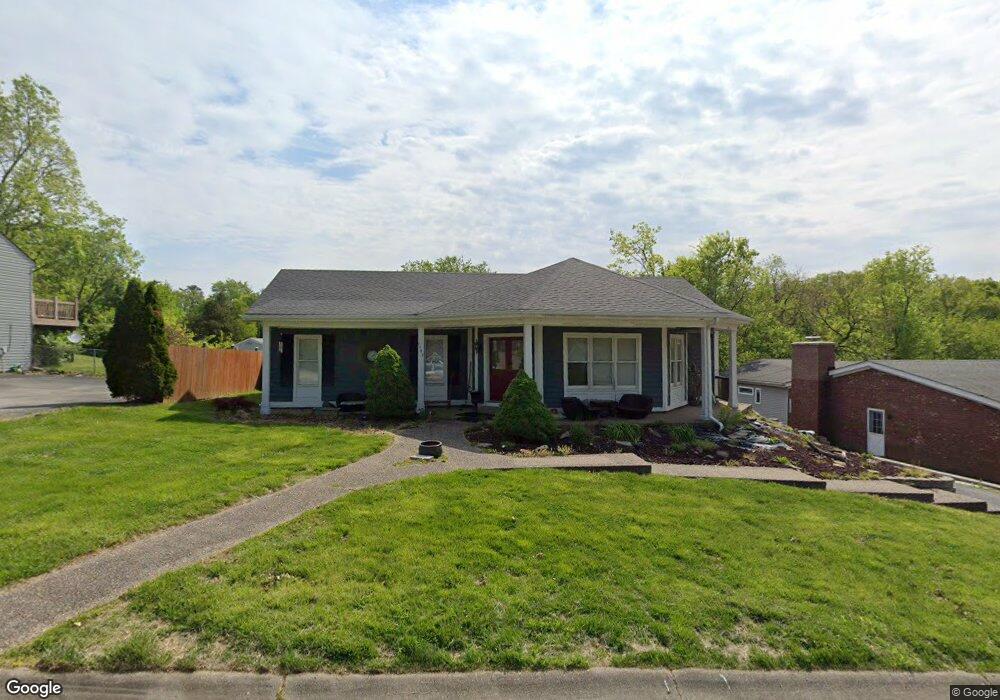
Discover your dream home in the sought-after Carriage Estates! This beautifully maintained 3-
bedroom, 3 full bathroom home offers a perfect blend of style, comfort, and functionality. Step
inside to find luxury vinyl plank (LVP) flooring throughout the first floor, creating a seamless
and modern look. The kitchen is a chef's delight, featuring granite countertops, stainless steel
appliances, and ample cabinet space. The first-floor primary bedroom offers the convenience of
single-level living and boasts an en suite bathroom for your private retreat. The finished
basement provides additional living space, perfect for a recreation room, home gym, or office.
Enjoy outdoor living on the large back deck, ideal for entertaining or relaxing, or sip your
morning coffee on the charming covered front porch. With a 2-car garage, you'll have plenty of
storage and parking. This home has everything you need and more, all in a location that can't be
beat. Schedule your showing today to see why Carriage Estates is the perfect place to call home!

Ownership History

Date Name Owned For Owner Type

Purchase Details

Listed on
Jan 3, 2025
Closed on
Feb 4, 2025
Sold by
Meyer Charlene L and Frazier Luke T
Bought by
Helton Alianda
Seller's Agent
Matthew Henegar
RE/MAX FIRST
Buyer's Agent
Adam McGuirk
Schuler Bauer Real Estate Services ERA Powered (N
List Price
$294,900
Sold Price
$298,000
Premium/Discount to List
$3,100
1.05%
Views
38
Current Estimated Value
$316,858

Home Financials for this Owner

Home Financials are based on the most recent Mortgage that was taken out on this home.
Estimated Appreciation
$18,858
Avg. Annual Appreciation
7.77%
Original Mortgage
$237,586
Outstanding Balance
$236,043
Interest Rate
6.45%
Mortgage Type
FHA
Estimated Equity
$80,815

Purchase Details

Listed on
Jun 30, 2023
Closed on
Jun 29, 2023
Sold by
Paige Lamar
Bought by
Meyer Charlene L and Frazier Luke T
Seller's Agent
Matthew Henegar
RE/MAX FIRST
Buyer's Agent
Matthew Henegar
RE/MAX FIRST
List Price
$265,000
Sold Price
$265,000
Views
2

Home Financials for this Owner

Home Financials are based on the most recent Mortgage that was taken out on this home.
Avg. Annual Appreciation
7.66%
Original Mortgage
$260,200
Interest Rate
6.25%
Mortgage Type
FHA

Purchase Details

Closed on
Jan 16, 2016
Sold by
Paige Lamar and Lane Tina Marie
Bought by
Paige Lamar

Purchase Details

Listed on
Oct 28, 2012
Closed on
Jun 21, 2013
Sold by
Acker Melissa
Bought by
Lane Tina Marie and Paige Lamar
Seller's Agent
Michael Osborne
Knobstone Properties LLC
Buyer's Agent
OUTSIDE AGENT
OUTSIDE COMPANY
List Price
$125,000
Sold Price
$66,300
Premium/Discount to List
-$58,700
-46.96%

Home Financials for this Owner

Home Financials are based on the most recent Mortgage that was taken out on this home.
Avg. Annual Appreciation
13.35%

Purchase Details

Listed on
Oct 28, 2012
Closed on
Jun 6, 2013
Sold by
Perkins Agent Holly
Bought by
Chris Schlosser Auth Agent
Seller's Agent
Michael Osborne
Knobstone Properties LLC
Buyer's Agent
OUTSIDE AGENT
OUTSIDE COMPANY
List Price
$125,000
Sold Price
$66,300
Premium/Discount to List
-$58,700
-46.96%

Purchase Details

Closed on
Jul 6, 2012
Sold by
Pnc Mortgage
Bought by
Secretary Of Hud

Purchase Details

Closed on
Jul 3, 2012
Sold by
Stephens Matthew C and Stephens Tina L
Bought by
Pnc Mortgage
Source: Public Records

Range of Values:

--
Value Increase
--
Percent Increase
--
Adjusted for Inflation
Collateral Analytics

Collateral Analytics Collateral Analytics AVMs (Automated Valuation Model) employ a number of statistical approaches combined with neighborhood-specific comparable selection guarantees the most up-to-date and precise valuations.

Not Available

Collateral Analytics does not have data for the current month. Please view the chart for historical values.

ICE

ICE Mortgage Technology ICE Mortgage Technology’s AVM (Automated Valuation Model) is a state-of-the-art online residential property valuation tool that provides a quick and accurate estimate of the value of almost any home in the U.S.

Not Available

ICE Mortgage Technology does not have data for the current month. Please view the chart for historical values.

First American

First American First American Data & Analytics’ next-generation AVM combines unrivaled data assets with a blended ensemble of valuation models to produce highly accurate, reliable valuations you can trust.

Not Available

First American does not have data for the current month. Please view the chart for historical values.

Quantarium

Quantarium Quantarium’s valuation service, repeatedly proven the industry’s most accurate and comprehensive, is supercharged with a self-learning and auto-tuning AI engine that continually becomes smarter and more accurate as it processes daily inputs from the industry’s leading RE data lake.

Not Available

Quantarium does not have data for the current month. Please view the chart for historical values.

Average Value
Not Available
List Price
Sold Price
Create a Home Valuation Report for This Property
The Home Valuation Report is an in-depth analysis detailing your home's value as well as a comparison with similar homes in the area

Home Values in the Area

Source: Public Records

Average Home Value in this Area


Source: Public Records

Purchase History

Date Buyer Sale Price Title Company
Helton Alianda $298,000 None Listed On Document
Meyer Charlene L $265,000 None Listed On Document
Paige Lamar -- --
Lane Tina Marie $74,000 --
Chris Schlosser Auth Agent $66,300 --
Secretary Of Hud -- None Available
Pnc Mortgage $147,369 None Available
Source: Public Records

Mortgage History

Date Status Borrower Loan Amount
Open Helton Alianda $237,586
Previous Owner Meyer Charlene L $260,200
Source: Public Records

Property History

Date Event Price List to Sale Price per Sq Ft Prior Sale
01/31/2025 01/31/25 Sold $298,000 +1.1% $158 / Sq Ft View Prior Sale
01/04/2025 01/04/25 Pending -- -- --
01/03/2025 01/03/25 For Sale $294,900 +11.3% $156 / Sq Ft
06/30/2023 06/30/23 Sold $265,000 0.0% $140 / Sq Ft View Prior Sale
06/30/2023 06/30/23 Pending -- -- --
06/30/2023 06/30/23 For Sale $265,000 +299.7% $140 / Sq Ft
06/06/2013 06/06/13 Sold $66,300 -47.0% $42 / Sq Ft View Prior Sale
04/26/2013 04/26/13 Pending -- -- --
10/28/2012 10/28/12 For Sale $125,000 -- $79 / Sq Ft

Tax History Compared to Growth

Source: Public Records

Tax History

Year Tax Paid Tax Assessment Tax Assessment Total Assessment is a certain percentage of the fair market value that is determined by local assessors to be the total taxable value of land and additions on the property. Land Improvement
2024 $2,300 $217,000 $25,300 $191,700
2023 $2,146 $221,300 $25,300 $196,000
2022 $2,238 $214,400 $25,300 $189,100
2021 $1,938 $198,000 $25,300 $172,700
2020 $2,159 $202,600 $25,300 $177,300
2019 $2,096 $196,500 $25,300 $171,200
2018 $3,672 $170,400 $25,300 $145,100
2017 $3,402 $154,300 $25,300 $129,000
2016 $3,056 $152,800 $25,300 $127,500
2014 $2,740 $137,000 $25,400 $111,600
2013 -- $133,300 $25,300 $108,000
Source: Public Records

Agents Affiliated with this Home

  • Section Image
  • Section Image
  • Section Image
  • Section Image
See All Agents

Map