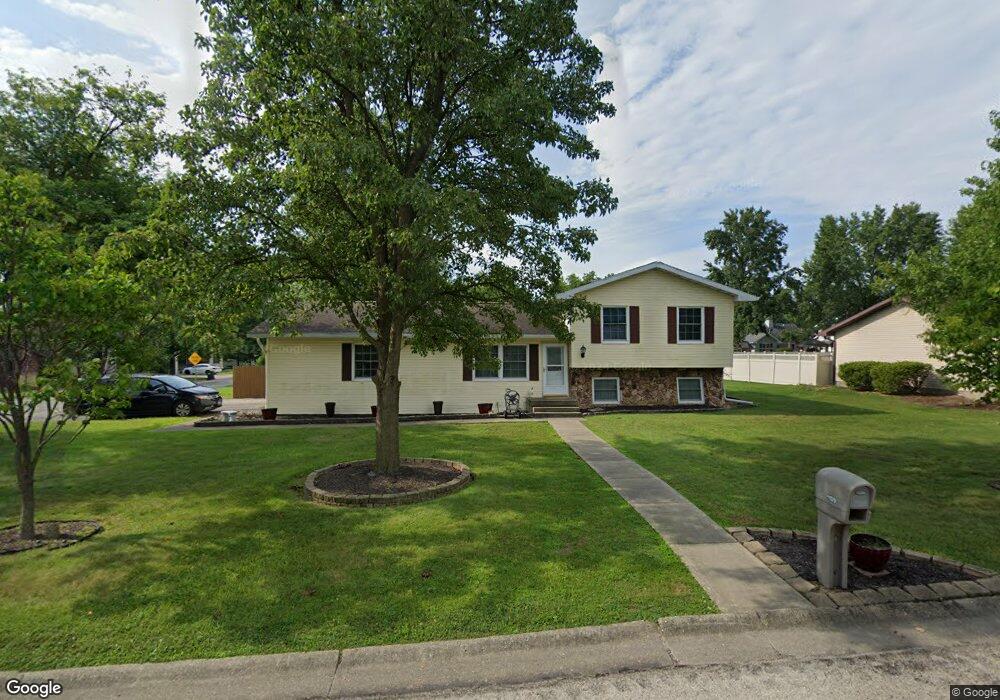
1109 Cedar Ln Marshall, IL 62441
Estimated Value: $80,000 - $99,784
Studio
--
Bath
1,780
Sq Ft
$51/Sq Ft
Est. Value
About This Home
This home is located at 1109 Cedar Ln, Marshall, IL 62441 and is currently estimated at $90,946, approximately $51 per square foot. 1109 Cedar Ln is a home located in Clark County with nearby schools including South Elementary School, North Elementary School, and Marshall Junior High School.
Ownership History
Date
Name
Owned For
Owner Type
Purchase Details
Closed on
May 17, 2023
Sold by
Whalen Wayne R
Bought by
Vice Devin
Current Estimated Value
Home Financials for this Owner
Home Financials are based on the most recent Mortgage that was taken out on this home.
Original Mortgage
$79,532
Outstanding Balance
$76,926
Interest Rate
6.28%
Mortgage Type
FHA
Estimated Equity
$14,020
Purchase Details
Closed on
Oct 5, 2018
Sold by
Morrill Brian
Bought by
Whalen Wayne R
Home Financials for this Owner
Home Financials are based on the most recent Mortgage that was taken out on this home.
Original Mortgage
$70,300
Interest Rate
4.87%
Mortgage Type
New Conventional
Purchase Details
Closed on
Aug 11, 2014
Sold by
Citibank N A
Bought by
Morrill Brian
Purchase Details
Closed on
Nov 22, 2013
Sold by
Leurs David W
Bought by
Citibank Na
Create a Home Valuation Report for This Property
The Home Valuation Report is an in-depth analysis detailing your home's value as well as a comparison with similar homes in the area
Home Values in the Area
Average Home Value in this Area
Purchase History
| Date | Buyer | Sale Price | Title Company |
|---|---|---|---|
| Vice Devin | $81,000 | None Listed On Document | |
| Whalen Wayne R | $74,000 | Attorney | |
| Morrill Brian | $13,750 | None Available | |
| Citibank Na | -- | None Available |
Source: Public Records
Mortgage History
| Date | Status | Borrower | Loan Amount |
|---|---|---|---|
| Open | Vice Devin | $79,532 | |
| Closed | Whalen Wayne R | $70,300 |
Source: Public Records
Tax History
| Year | Tax Paid | Tax Assessment Tax Assessment Total Assessment is a certain percentage of the fair market value that is determined by local assessors to be the total taxable value of land and additions on the property. | Land | Improvement |
|---|---|---|---|---|
| 2024 | $1,963 | $30,734 | $2,009 | $28,725 |
| 2023 | $1,243 | $20,391 | $1,930 | $18,461 |
| 2022 | $1,128 | $18,206 | $1,723 | $16,483 |
| 2021 | $1,055 | $17,015 | $1,610 | $15,405 |
| 2019 | $1,724 | $17,015 | $1,610 | $15,405 |
| 2018 | $1,858 | $17,015 | $1,610 | $15,405 |
| 2017 | $1,237 | $17,402 | $1,647 | $15,755 |
| 2016 | $1,251 | $17,015 | $1,610 | $15,405 |
| 2015 | $1,263 | $17,481 | $1,654 | $15,827 |
| 2014 | $2,123 | $17,015 | $1,610 | $15,405 |
| 2013 | $2,123 | $19,490 | $1,750 | $17,740 |
Source: Public Records
Map
Nearby Homes
- 1014 Plum St
- 1314 Archer Ave
- 107 Linden St
- 812 S 4th St
- 103 Kyden Dr
- 209 Elm St
- 10 Rose Ln
- 7 Willow Ln
- 10 Lakeview Dr
- 15827 N Oak Crest Rd
- 4 Woodridge Ln
- 17383 N Hummingbird Ln
- 104 Thomas Dr
- 14568 U S 40
- 000 E Clark Center Rd
- 12040 N Fox Rd
- 19996 N 2250th St
- South 500th Grand Turn Rd
- 0 Crooked Ln Unit Lot WP001 24435818
- 1165 Crooked Ln
Your Personal Tour Guide
Ask me questions while you tour the home.